Fig. 8
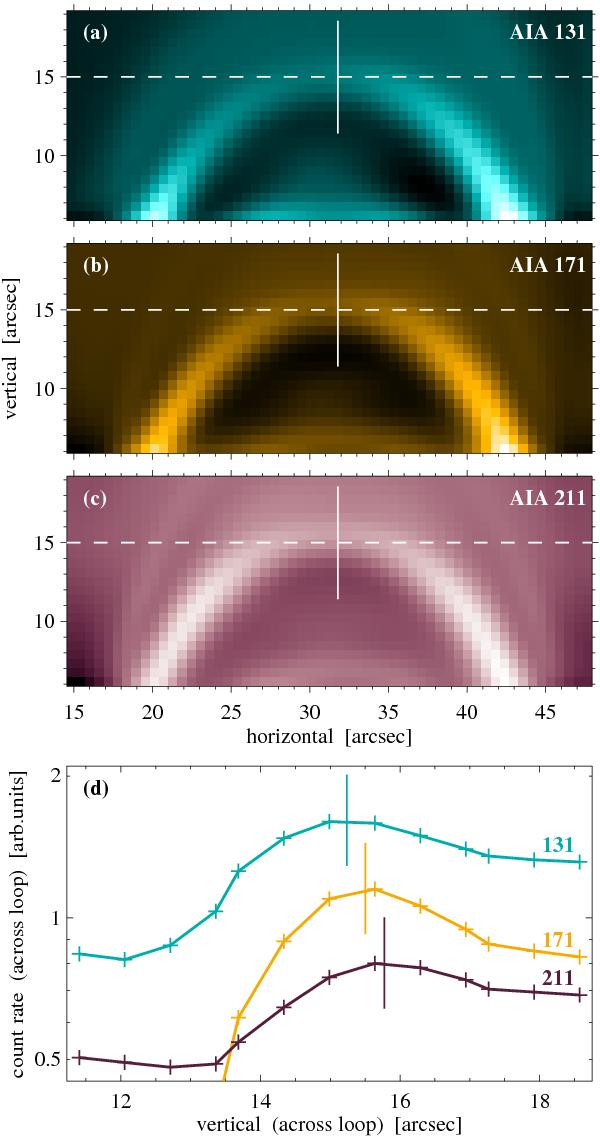
Appearance of loop in different passbands of AIA. Panels a) to c) display the loop seen from the side in AIA 131, 171, and 211 Å. The peak contribution of these bands is at 0.6, 0.8, and 1.9 MK, respectively. The images are shown with the AIA pixel size, and with the AIA PSF applied and background-subtracted. The horizontal dashed line is plotted for reference only. The bottom panel d) shows the variation across the loop near its apex as indicated by the vertical line in the top panels (ordinate plotted logarithmically). The vertical lines in panel d) indicate the position of maximum emission in the respective band.
Current usage metrics show cumulative count of Article Views (full-text article views including HTML views, PDF and ePub downloads, according to the available data) and Abstracts Views on Vision4Press platform.
Data correspond to usage on the plateform after 2015. The current usage metrics is available 48-96 hours after online publication and is updated daily on week days.
Initial download of the metrics may take a while.