Fig. 6
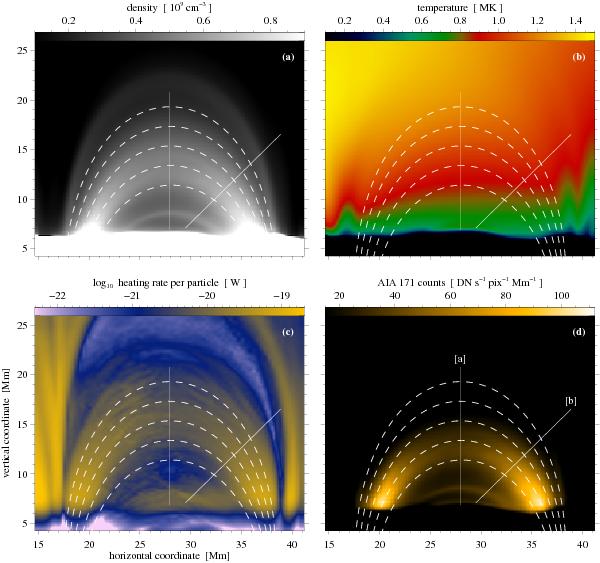
Two-dimensional cut through the loop plane. Panels a) and b) show the density and temperaure at a snapshot at the same time as Figs. 1 to 5. Overplotted are the magnetic field lines (dashed) defining the magnetic loop, which roughly coincides with the plasma loop defined by the density structure. Panel c) displays the heating rate per particle averaged over 10 min before the time of the other snapshots. This also roughly coincides with the magnetic loop. Panel d) shows the synthesized emission in the AIA 171 Å channel defining the eLoop outlining the EUV emission. This is smaller than the magnetic loop and the plasma loop and has roughly constant width. The lines labeled [a] and [b] indicate the cuts shown in Fig. 7.
Current usage metrics show cumulative count of Article Views (full-text article views including HTML views, PDF and ePub downloads, according to the available data) and Abstracts Views on Vision4Press platform.
Data correspond to usage on the plateform after 2015. The current usage metrics is available 48-96 hours after online publication and is updated daily on week days.
Initial download of the metrics may take a while.