Fig. 5
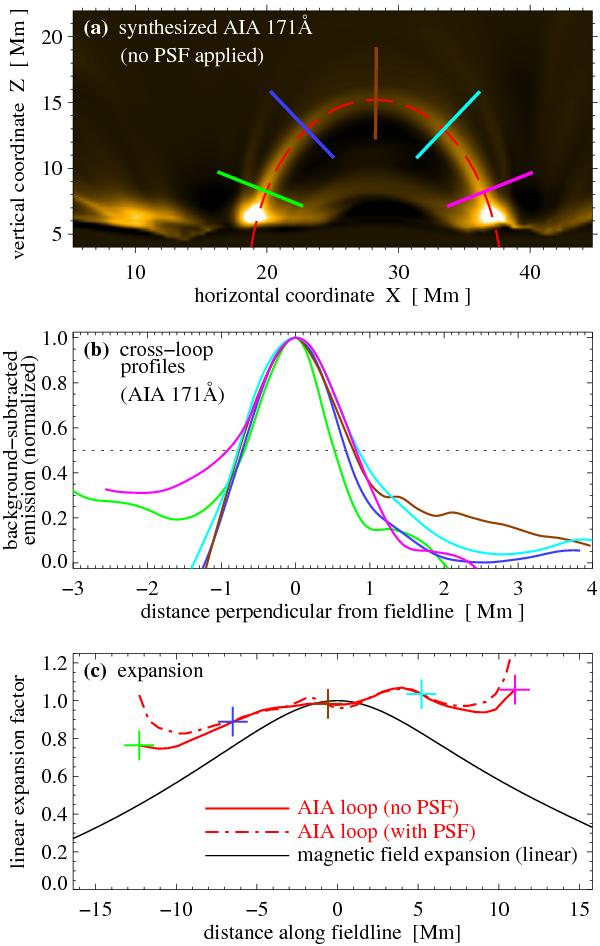
Analysis of the width of the synthesized coronal loop. Panel a) displays the emission (same as Fig. 4, now without the point spread function, PSF). Overplotted are the magnetic field line along the loop spine (red dashed) and selected cross sections. Panel b) shows the (normalized) cross-sectional intensity profiles along the lines in panel a) with matching color coding. Panel c) shows the width of the loop normalized to the width at the apex, which defines the (linear) expansion of the loop. This expansion with (dashed) and without (solid) the PSF applied to the synthesied image is plotted in red. Overplotted is the magnetic expansion (black; ∝ | B | − 1/2) along the spine field line. The crosses indicate the expansion at the cross-sectional profiles in panel a).
Current usage metrics show cumulative count of Article Views (full-text article views including HTML views, PDF and ePub downloads, according to the available data) and Abstracts Views on Vision4Press platform.
Data correspond to usage on the plateform after 2015. The current usage metrics is available 48-96 hours after online publication and is updated daily on week days.
Initial download of the metrics may take a while.