Fig. 2
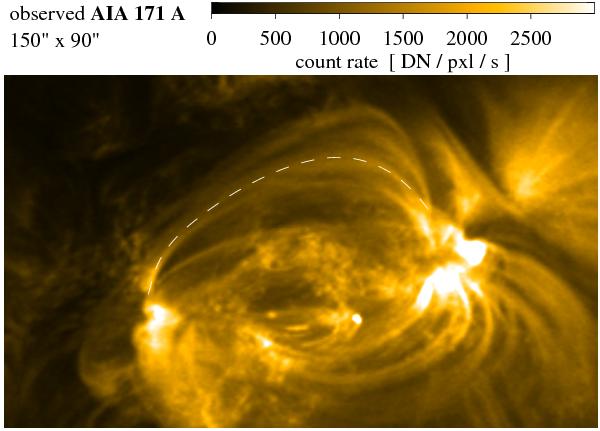
Real observation of an active region. This snapshot shows an active region observed with AIA in the 171 Å bandpass on Aug. 08 2010 at 01:13:49 UTC. The field-of-view covers 150′′ × 90′′ centered at solar (X,Y) ≈ (185′′, 310′′). South is top. The white dashed line indicates the position of a loop investigated further in Fig. 3. The temporal evolution over 75 min (from 00:36 to 01:51) is shown in a movie available in the on-line edition and at http://www.mps.mpg.de/data/outgoing/peter/papers/2012-loops/aa19473-peter-fig2.mp4.
Current usage metrics show cumulative count of Article Views (full-text article views including HTML views, PDF and ePub downloads, according to the available data) and Abstracts Views on Vision4Press platform.
Data correspond to usage on the plateform after 2015. The current usage metrics is available 48-96 hours after online publication and is updated daily on week days.
Initial download of the metrics may take a while.