Fig. 1
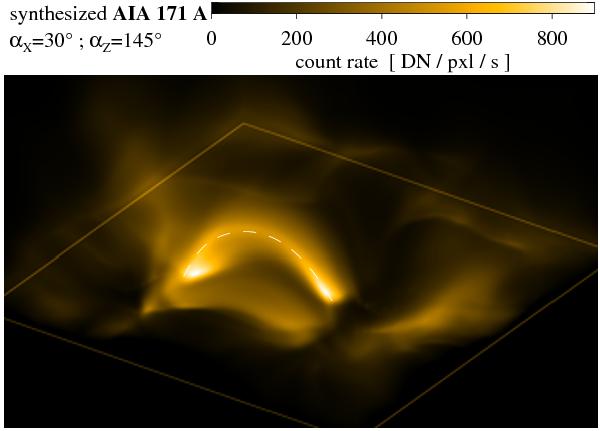
View of the modeled corona above an active region as would be seen by AIA/SDO in the 171 Å channel dominated by emission from below about 106 K. The rectangle indicates the boundaries of the computational domain (50 × 50 × 30 Mm) at the coronal base. The most prominent loop connects the periphery of the two magnetic concentrations at the surface (not shown here) and has a roughly semicircular shape with about 30 Mm length. In the vicinity of the active region, hazy emission can be seen that is associated with the diffuse background corona in the quiet Sun. The white dashed line indicates the position of a loop investigated further in Fig. 3. The temporal evolution over 50 min is shown in a movie available in the online edition and at http://www.mps.mpg.de/data/outgoing/peter/papers/2012-loops/aa19473-peter-fig1.mp4.
Current usage metrics show cumulative count of Article Views (full-text article views including HTML views, PDF and ePub downloads, according to the available data) and Abstracts Views on Vision4Press platform.
Data correspond to usage on the plateform after 2015. The current usage metrics is available 48-96 hours after online publication and is updated daily on week days.
Initial download of the metrics may take a while.