Free Access
Fig. 3
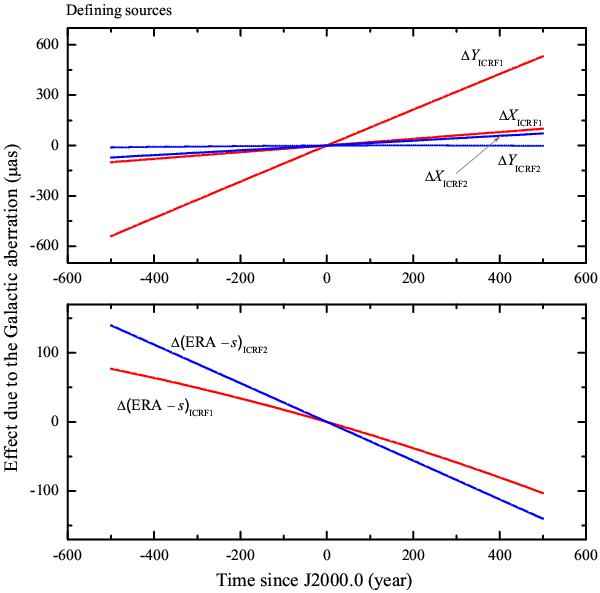
Time series of the effect of Galactic aberration on the CIP location (top plot) and ERA (bottom plot) in ± 500 years around J2000.0, based on the ICRF1 and ICRF2 defining source positions. The CIP location X and Y, necessary for computing ΔX, ΔY, and Δ(ERA − s) are derived from the IAU 2006/2000 precession-nutation model.
Current usage metrics show cumulative count of Article Views (full-text article views including HTML views, PDF and ePub downloads, according to the available data) and Abstracts Views on Vision4Press platform.
Data correspond to usage on the plateform after 2015. The current usage metrics is available 48-96 hours after online publication and is updated daily on week days.
Initial download of the metrics may take a while.