Fig. 1
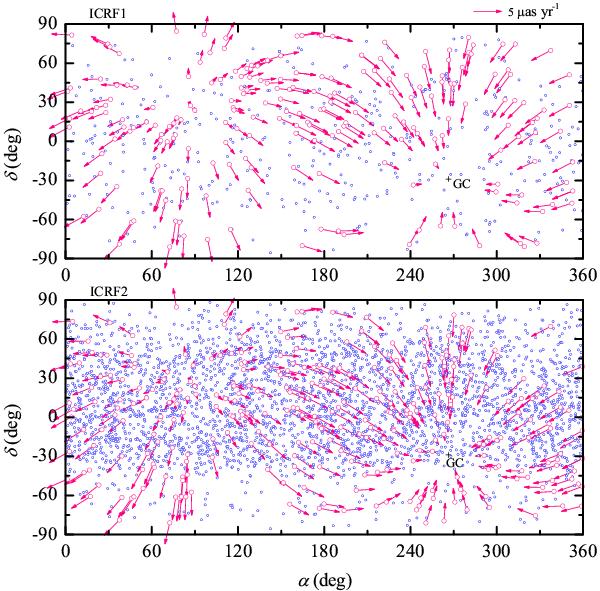
The distribution of radio sources in the ICRF1 (top panel) and ICRF2 (bottom panel) catalogs where the red open circles represent the 212 and 295 defining sources of corresponding catalogs, respectively. The arrows represent the proper motions of the defining sources resulting from the theoretical Galactic aberration. The catalogs are from the ICRS data center operated at Paris Observatory, http://hpiers.obspm.fr/icrs-pc/.
Current usage metrics show cumulative count of Article Views (full-text article views including HTML views, PDF and ePub downloads, according to the available data) and Abstracts Views on Vision4Press platform.
Data correspond to usage on the plateform after 2015. The current usage metrics is available 48-96 hours after online publication and is updated daily on week days.
Initial download of the metrics may take a while.