Fig. A.1
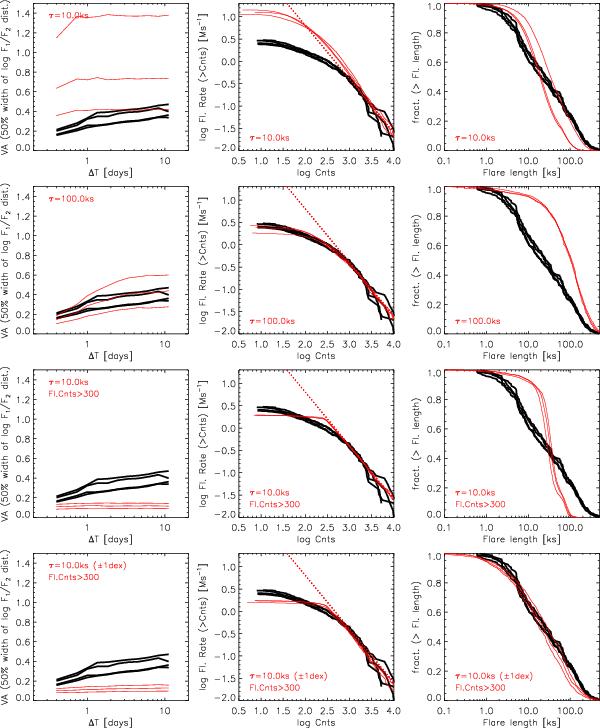
Results of our VA and flare analysis on simulated lightcurves consisting of a superposition of flaring and continuous emission (see text). From left to right we show measured VAs, flare frequencies, and flare durations. In all cases the three red lines refer to simulation sets that reproduce a given median count-rate: 3, 4, and 6 cnts/ks, spanning the median count rates of our four main stellar samples. Observed quantities for these four samples are drawn in black, reproduced from Figs. 2 and 6. The four rows refer to four different simulation sets that differ for the assumed flare decay-times and, in last two cases, for a lower cutoff in flare intensities (in counts), with a corresponding addition of a continuous emission level. From top to bottom: τ = 10 ks (no cutoff/continuum), τ = 100 ks (no cutoff/continuum), τ = 10 ks (>300 counts plus continuum), and τ = 10 ks ± 1 dex (>300 counts plus continuum).
Current usage metrics show cumulative count of Article Views (full-text article views including HTML views, PDF and ePub downloads, according to the available data) and Abstracts Views on Vision4Press platform.
Data correspond to usage on the plateform after 2015. The current usage metrics is available 48-96 hours after online publication and is updated daily on week days.
Initial download of the metrics may take a while.