Fig. 8
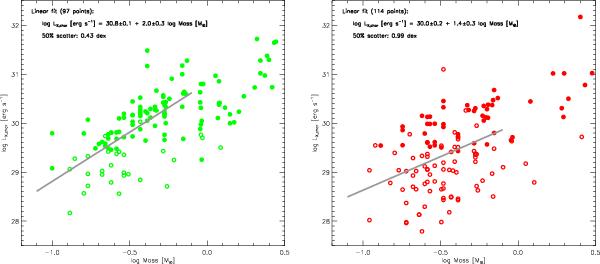
Characteristic LX vs. stellar mass for WTTSs and CTTSs (left and right panels, respectively). The samples are selected in the same way as for our variability study except that in this case we did not impose an X-ray flux (or count-rate) limit. Filled circles refer to the count-rate-limited sample used for the variability study. Linear fits are computed from all points (both filled and empty symbols) within the x-axis range spanned by the gray lines that represent them.
Current usage metrics show cumulative count of Article Views (full-text article views including HTML views, PDF and ePub downloads, according to the available data) and Abstracts Views on Vision4Press platform.
Data correspond to usage on the plateform after 2015. The current usage metrics is available 48-96 hours after online publication and is updated daily on week days.
Initial download of the metrics may take a while.