Fig. 7
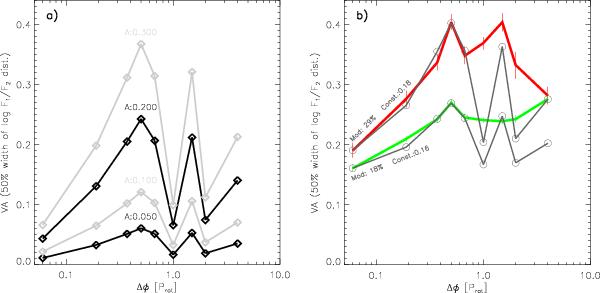
Left: VA vs. rotational phase for simulated lightcurves. The simulations reproduce sinusoidally varying stars, observed with the COUP observation and analyzed in the same way as the real data. Four curves show results for modulation amplitudes from 5% to 30%, as labeled. Right: comparison of the trends observed in the soft band for WTTS and CTTS (green and red lines, respectively) with two simulated VA curves (labeled gray lines) obtained by summing in quadrature the VAs for pure sinusoidal modulation (with amplitudes of 18% and 29%) with constant non-modulated VAs (0.16 and 0.18 dex, see labels). Modulation amplitudes and constant contributions are chosen to reproduce the observed VAs at Δφ = 0.06 (the leftmost points) and Δφ = 0.5 (the first maxima).
Current usage metrics show cumulative count of Article Views (full-text article views including HTML views, PDF and ePub downloads, according to the available data) and Abstracts Views on Vision4Press platform.
Data correspond to usage on the plateform after 2015. The current usage metrics is available 48-96 hours after online publication and is updated daily on week days.
Initial download of the metrics may take a while.