Free Access
Fig. 6
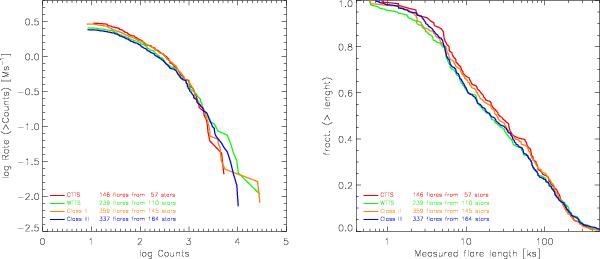
Left: rate of occurrence of flares as a function of minimum number of flare counts for our four main samples. The legend indicates the color of the lines representing each sample as well as the respective numbers of detected flares. Right: cumulative distribution of flare durations for the same four samples.
Current usage metrics show cumulative count of Article Views (full-text article views including HTML views, PDF and ePub downloads, according to the available data) and Abstracts Views on Vision4Press platform.
Data correspond to usage on the plateform after 2015. The current usage metrics is available 48-96 hours after online publication and is updated daily on week days.
Initial download of the metrics may take a while.