Fig. 4
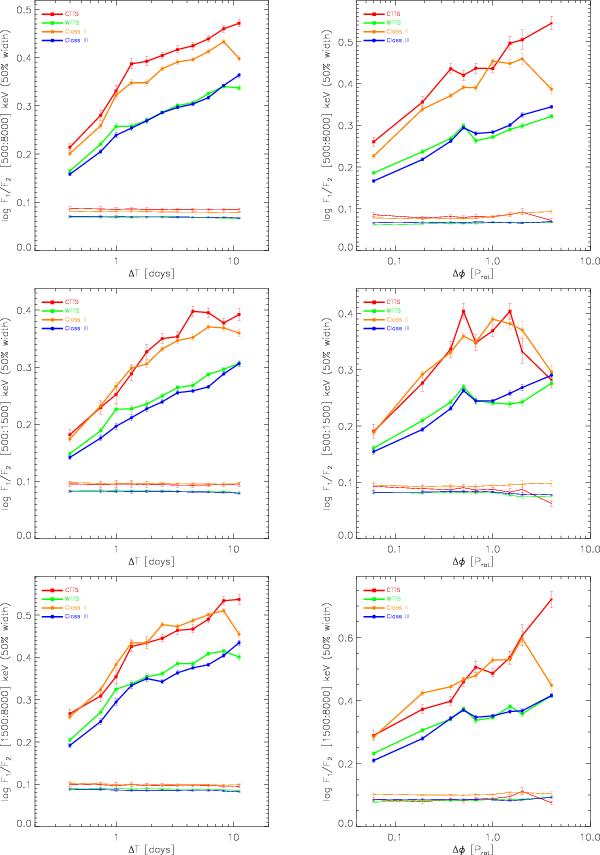
Variability amplitude, VA, as a function of timescale (left column) and rotational phase difference (right column), for CTTS, WTTS, Class II, and Class III stars (see legends within panels), and for three different X-ray energy bands: full (0.5–8.0 keV, top row), soft (0.5–1.5 keV, middle), and hard (1.5–8.0 keV, bottom). As described in Sect. 3, the VA for each sample and x-axis value (Δt or Δφ) is defined as the 50% width of the distribution of log F1/F2 (cf. Fig. 2), i.e. of the difference between the 75% and 25% quantiles. Formal error bars reflect photon statistics and are estimated thorough Monte Carlo simulations. Thick lines refer to the VAs derived from the data, while thin lines with error bars and matching color indicate the contribution of Poisson noise (also estimated with Monte Carlo simulations).
Current usage metrics show cumulative count of Article Views (full-text article views including HTML views, PDF and ePub downloads, according to the available data) and Abstracts Views on Vision4Press platform.
Data correspond to usage on the plateform after 2015. The current usage metrics is available 48-96 hours after online publication and is updated daily on week days.
Initial download of the metrics may take a while.