Fig. 3
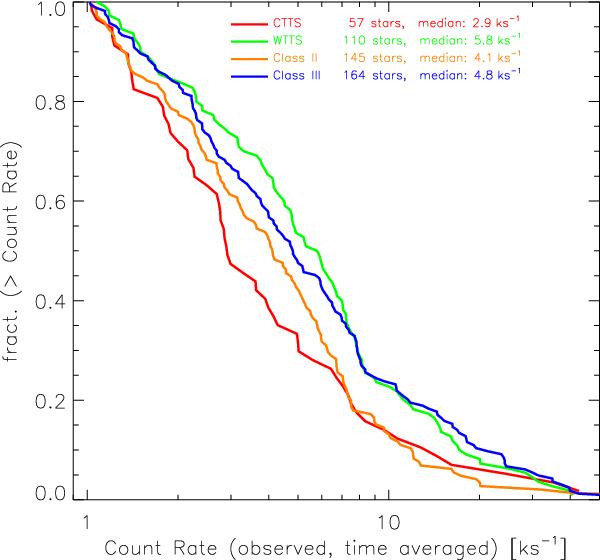
Distributions of count rates for our flux-limited samples of CTTS (red), WTTS (green), Class II (orange), and Class III (blue) stars. Sample sizes and median count rates are reported in the legend. Count rates are defined here as the total number of counts detected in the 25 × 30 ks time intervals under consideration, divided by the exposure time, 750 ks.
Current usage metrics show cumulative count of Article Views (full-text article views including HTML views, PDF and ePub downloads, according to the available data) and Abstracts Views on Vision4Press platform.
Data correspond to usage on the plateform after 2015. The current usage metrics is available 48-96 hours after online publication and is updated daily on week days.
Initial download of the metrics may take a while.