Fig. 2
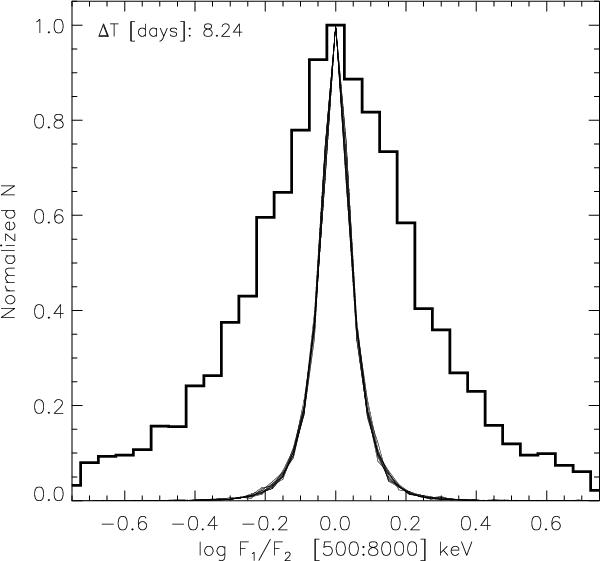
Normalized histogram of all flux ratios, log (F1/F2), taken between 30 ks time intervals separated by Δt = 7.1–9.6 days (logarithmic mean: 8.24 days), for the 167 Class III stars in our flux-limited sample (broken line). The narrower distribution, actually a bundle of ten almost indistinguishable ones, represents the contribution of Poisson statistics to the observed distribution as determined from Monte Carlo simulations (see text).
Current usage metrics show cumulative count of Article Views (full-text article views including HTML views, PDF and ePub downloads, according to the available data) and Abstracts Views on Vision4Press platform.
Data correspond to usage on the plateform after 2015. The current usage metrics is available 48-96 hours after online publication and is updated daily on week days.
Initial download of the metrics may take a while.