Fig. B.1
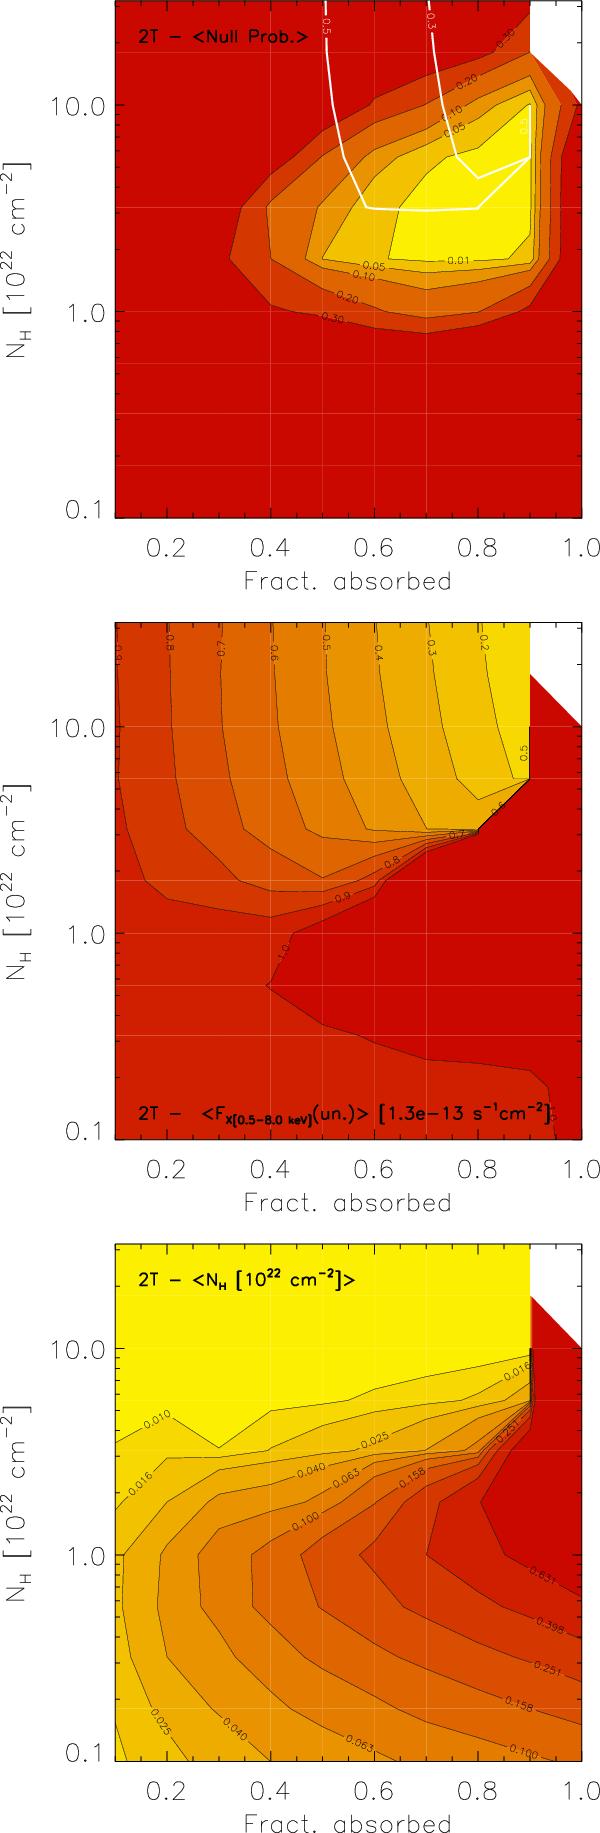
Results of the simulations of 1T, two-NH spectra (~18 000 counts for NH = 0) fitted with 2T, one-NH models. The black contours in the upper panel show the average null probability as a function of the fraction of obscured emission measure, fabs, and the column density of the obscuring material, NH. The middle and lower panels show contour plots of the mean unabsorbed flux (in the 0.5–8.0 kV band, in units of 1.3 × 10⁻¹³ s-1 cm-2), and of the mean NH (units 1022 cm-2), both obtained from the spectral fits. The two white contours in the upper panel are repeated from the middle panel and show the loci corresponding to a 50% and 70% reduction in measured flux.
Current usage metrics show cumulative count of Article Views (full-text article views including HTML views, PDF and ePub downloads, according to the available data) and Abstracts Views on Vision4Press platform.
Data correspond to usage on the plateform after 2015. The current usage metrics is available 48-96 hours after online publication and is updated daily on week days.
Initial download of the metrics may take a while.