Free Access
Fig. 1
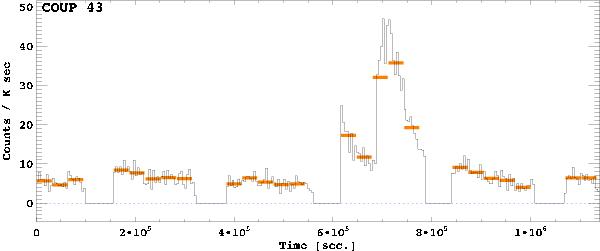
Example X-ray light-curve for a bright COUP source. The horizontal segments, superimposed on the lightcurve (black line), indicate time intervals and relative photon fluxes for the 25 30 ks segments on which the variability analysis is based.
Current usage metrics show cumulative count of Article Views (full-text article views including HTML views, PDF and ePub downloads, according to the available data) and Abstracts Views on Vision4Press platform.
Data correspond to usage on the plateform after 2015. The current usage metrics is available 48-96 hours after online publication and is updated daily on week days.
Initial download of the metrics may take a while.