Free Access
Fig. 8
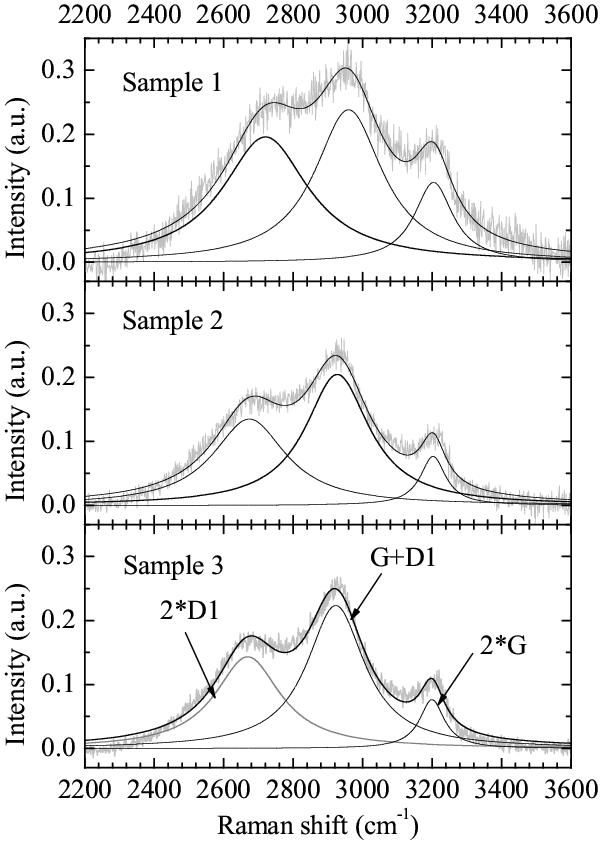
Second-order Raman shift of the soot samples (in gray). The baseline was subtracted and the spectra were normalized to the peak amplitude of the G band. The fit was performed using a sum of 3 Lorentzians (in black). The individual bands are indicated for sample 3, but are the same for all samples.
Current usage metrics show cumulative count of Article Views (full-text article views including HTML views, PDF and ePub downloads, according to the available data) and Abstracts Views on Vision4Press platform.
Data correspond to usage on the plateform after 2015. The current usage metrics is available 48-96 hours after online publication and is updated daily on week days.
Initial download of the metrics may take a while.