Free Access
Fig. 6
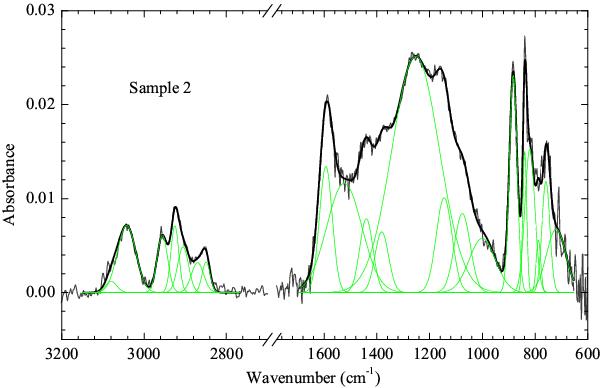
IR absorption spectrum of sample 2 after continuum subtraction (grey curve). The deconvolution of the spectrum obtained by a sum of Gaussian bands is shown in black, together with the individual Gaussians in green.
Current usage metrics show cumulative count of Article Views (full-text article views including HTML views, PDF and ePub downloads, according to the available data) and Abstracts Views on Vision4Press platform.
Data correspond to usage on the plateform after 2015. The current usage metrics is available 48-96 hours after online publication and is updated daily on week days.
Initial download of the metrics may take a while.