Fig. 5
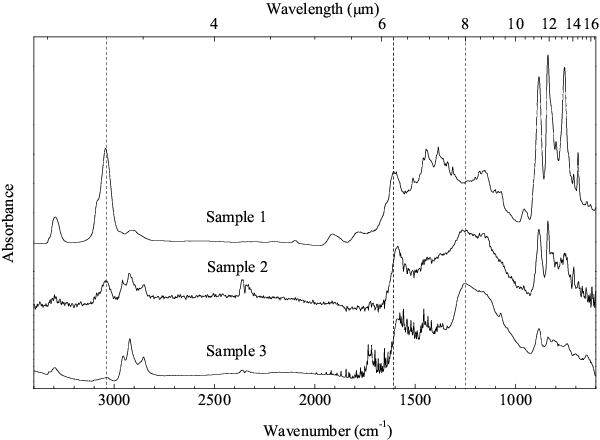
IR absorption spectra of the three soot samples after continuum subtraction. An offset has been added for visual convenience. The spectra were normalized altogether in order to match the intensity of the band at 1600 cm-1. CO2 spectral contamination at about 2400 cm-1 for sample 2 and H2O spectral contamination in the 1800−1400 cm-1 range for sample 3 may be seen due to slight variations of the purge of the spectrometer. The vertical dotted line are centered on 3040, 1610, and 1250 cm-1.
Current usage metrics show cumulative count of Article Views (full-text article views including HTML views, PDF and ePub downloads, according to the available data) and Abstracts Views on Vision4Press platform.
Data correspond to usage on the plateform after 2015. The current usage metrics is available 48-96 hours after online publication and is updated daily on week days.
Initial download of the metrics may take a while.