Fig. 4
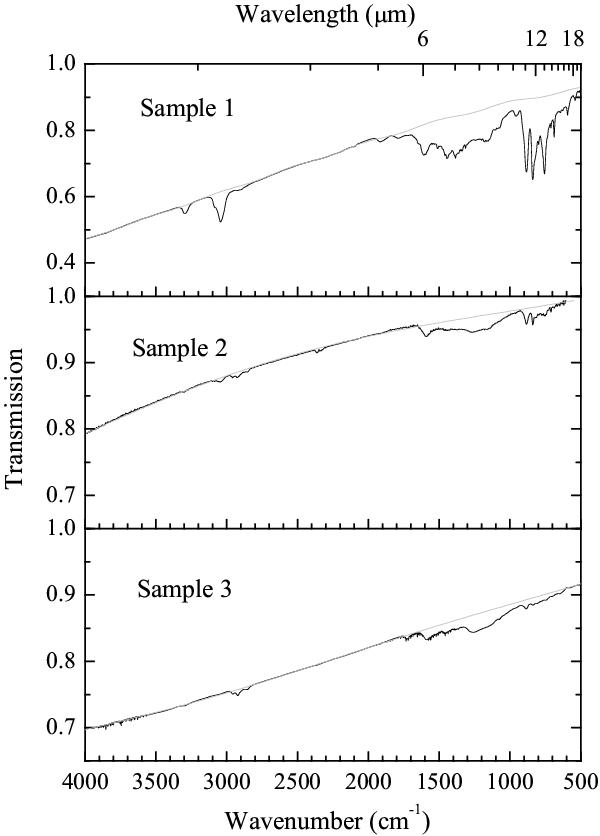
Infrared transmission spectra, as recorded, of soot samples produced under various conditions (see text for details). Note that the CH stretch bands around 3000 cm-1 vary strongly, tracing different hydrogenation of the carbon skeleton, and that the continuum to band ratios are also different between sample 1 and the two others. In grey, the fitted continua are superimposed.
Current usage metrics show cumulative count of Article Views (full-text article views including HTML views, PDF and ePub downloads, according to the available data) and Abstracts Views on Vision4Press platform.
Data correspond to usage on the plateform after 2015. The current usage metrics is available 48-96 hours after online publication and is updated daily on week days.
Initial download of the metrics may take a while.