Fig. 3
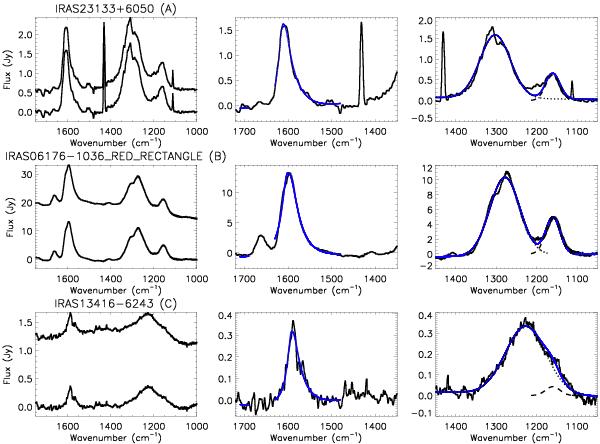
Three astronomical spectra illustrating the different classes A to C (from top to bottom, respectively). The sources names are reported. On the left panels, the upper spectra are before and the lower ones are after continuum subtraction. On the other panels, the Gaussian fits (blue) are superimposed on the zoom of the spectra to show the details of the 6.2 and 7.7 μm band spectral region.
Current usage metrics show cumulative count of Article Views (full-text article views including HTML views, PDF and ePub downloads, according to the available data) and Abstracts Views on Vision4Press platform.
Data correspond to usage on the plateform after 2015. The current usage metrics is available 48-96 hours after online publication and is updated daily on week days.
Initial download of the metrics may take a while.