Fig. 10
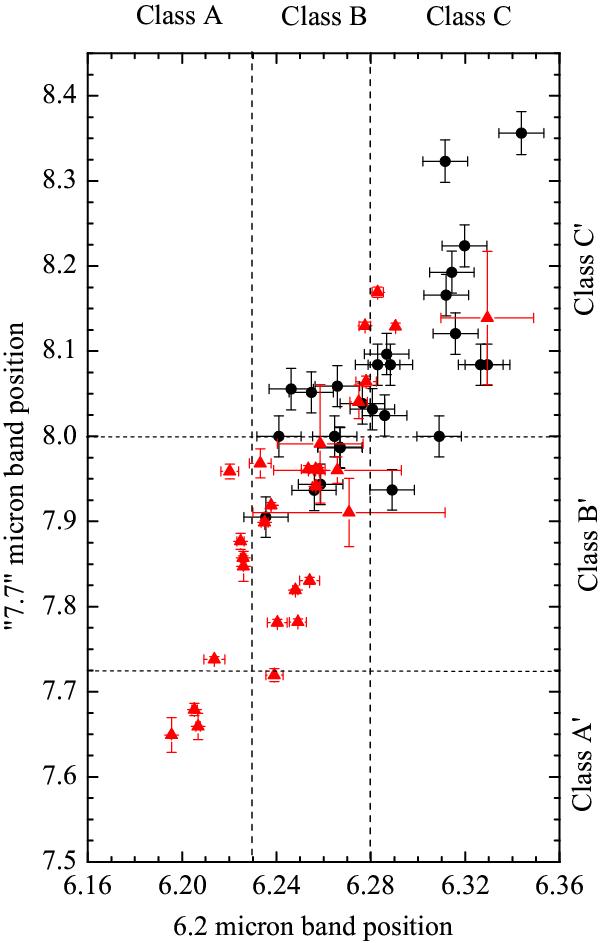
Evolution of the position of the defect band at about 8 μm versus that at about 6.2 μm. Black dots: experimental data extracted from a sample of soot. These belong to the same sample that was used in Pino et al. (2008) and only those exhibiting a clear defect band were chosen, as may be seen in samples 2 and 3. Red triangles: observational data extracted from a sample of astrophysical objects. The region of the different AIB classes for each bands are shown, as defined in Peeters et al. (2002).
Current usage metrics show cumulative count of Article Views (full-text article views including HTML views, PDF and ePub downloads, according to the available data) and Abstracts Views on Vision4Press platform.
Data correspond to usage on the plateform after 2015. The current usage metrics is available 48-96 hours after online publication and is updated daily on week days.
Initial download of the metrics may take a while.