Fig. 9
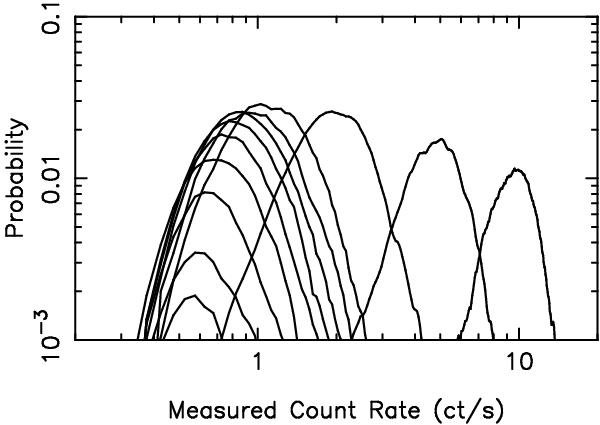
Probability of measuring a given output count rate for simulated sources of fixed input count rate. These probability density functions are based on bins of 0.05 ct/s width and are smoothed versions of the raw simulation data (using a 1-d top-hat smoothing filter with a width of 5 bins). From left to right (based on the position of the peak) the curves correspond to input count rates of 0.1, 0.2, 0.3, 0.4, 0.5, 0.6, 0.7, 0.8, 1.0, 2.0, 5.0 and 10 ct/s. For this plot the normalisation of the 0.1 ct/s curve has been scaled upwards by a factor of 5.
Current usage metrics show cumulative count of Article Views (full-text article views including HTML views, PDF and ePub downloads, according to the available data) and Abstracts Views on Vision4Press platform.
Data correspond to usage on the plateform after 2015. The current usage metrics is available 48-96 hours after online publication and is updated daily on week days.
Initial download of the metrics may take a while.