Fig. 8
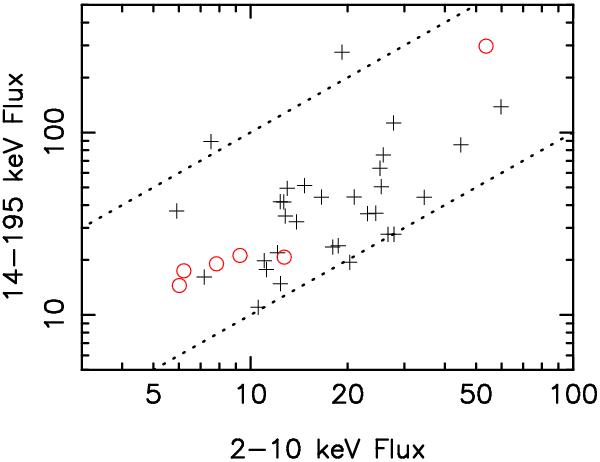
The correlation between the 14–195 keV flux (10-12 erg cm-2 s-1) measured by the BAT experiment on Swift and the XSS 2–10 keV flux (10-12 erg cm-2 s-1) for the 37 cross matches. XSS hard+soft are shown as crosses, whereas XSS hard-only sources are shown as circles (red). The dotted lines represent BAT:XSS flux ratios of 1:1 and 10:1 respectively.
Current usage metrics show cumulative count of Article Views (full-text article views including HTML views, PDF and ePub downloads, according to the available data) and Abstracts Views on Vision4Press platform.
Data correspond to usage on the plateform after 2015. The current usage metrics is available 48-96 hours after online publication and is updated daily on week days.
Initial download of the metrics may take a while.