Fig. 13
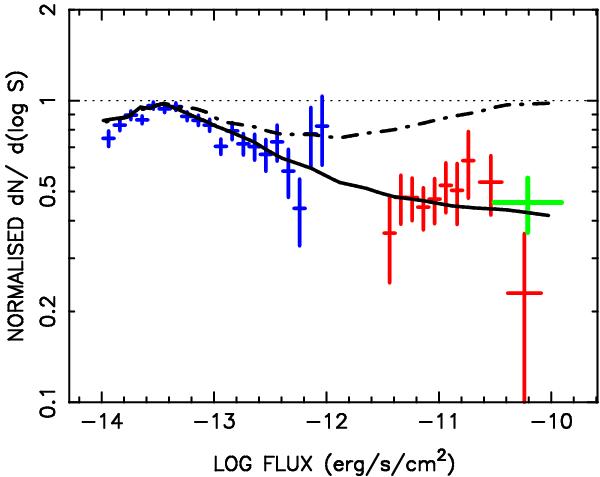
Differential 2–10 keV log N − log S curve for the XSS extragalactic sample (red data points), normalised to the Euclidean form. At the faint end the XSS results are compared with the differential 2–10 keV source counts derived from the 2XMM catalogue by Mateos et al. (2008) (blue points). At the bright end the comparison is with the HEAO-1 A2 AGN sample of Piccinotti et al. (1982) (green point). The solid curve is the prediction of the AGN source counts from the work of Gilli et al. (2007). The dot-dashed curve similarly represents the prediction of the total extragalactic counts, i.e., AGN plus clusters of galaxies. In drawing these comparisons account has been taken of the relevant survey sky areas. In this plot the normalisation factor has been matched to the counts of the AGN plus clusters at the high flux end.
Current usage metrics show cumulative count of Article Views (full-text article views including HTML views, PDF and ePub downloads, according to the available data) and Abstracts Views on Vision4Press platform.
Data correspond to usage on the plateform after 2015. The current usage metrics is available 48-96 hours after online publication and is updated daily on week days.
Initial download of the metrics may take a while.