Fig. 1
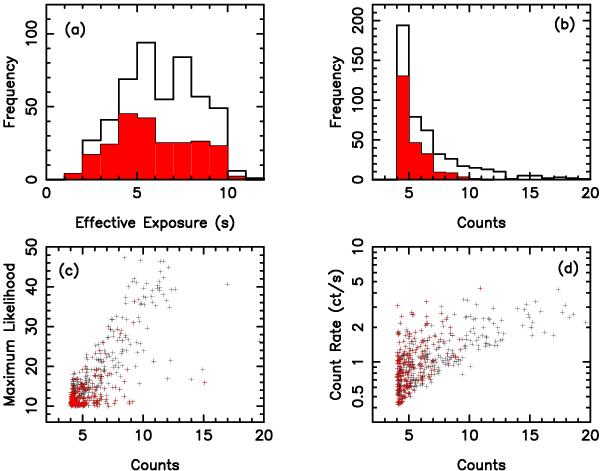
Characteristics of the 487 sources comprising the XSS hard-band selected sample. Panel a) distribution of the effective exposure time of the full sample. The filled (red) histogram corresponds to the subset of XSS sources which were detected only in the XSS hard band. Panel b) distribution of the net counts recorded in the hard (2–10 keV) band (after background subtraction). The filled (red) histogram again corresponds to the hard-band only sources. Panel c) net counts versus the maximum likelihood of the detection with the hard-band only sources plotted in red. Panel d) net counts versus the corresponding count rate in ct/s with the hard-band only sources plotted in red. For clarity the 20 sources with net hard counts in the range 20–70 are not shown in Panels b)–d).
Current usage metrics show cumulative count of Article Views (full-text article views including HTML views, PDF and ePub downloads, according to the available data) and Abstracts Views on Vision4Press platform.
Data correspond to usage on the plateform after 2015. The current usage metrics is available 48-96 hours after online publication and is updated daily on week days.
Initial download of the metrics may take a while.