Fig. 1
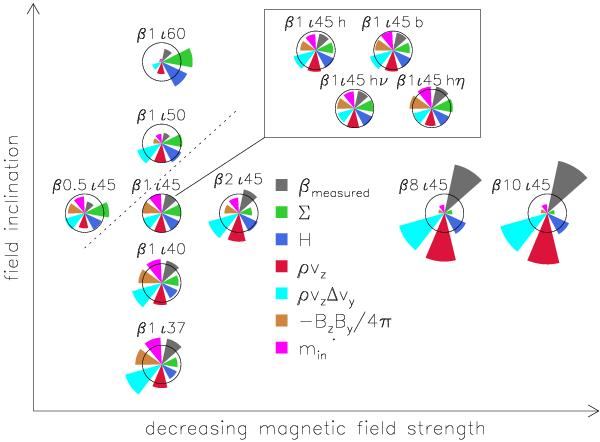
Visualization of the wind properties listed in Table 1. Each “flower” represents a simulation. The radii of the “petals” are proportional to the represented value. All values are normalized by the respective value in run β1ι45. Strong clumps develop in the cases to the left and above the dotted line (cf. Figs. 4–6). Note that the β in the simulation identifiers refers to the initial state and measures the absolute field strength, whereas the β represented by the gray petals refers to the actual value in the evolved state (see Table 1 and text).
Current usage metrics show cumulative count of Article Views (full-text article views including HTML views, PDF and ePub downloads, according to the available data) and Abstracts Views on Vision4Press platform.
Data correspond to usage on the plateform after 2015. The current usage metrics is available 48-96 hours after online publication and is updated daily on week days.
Initial download of the metrics may take a while.