Fig. 4
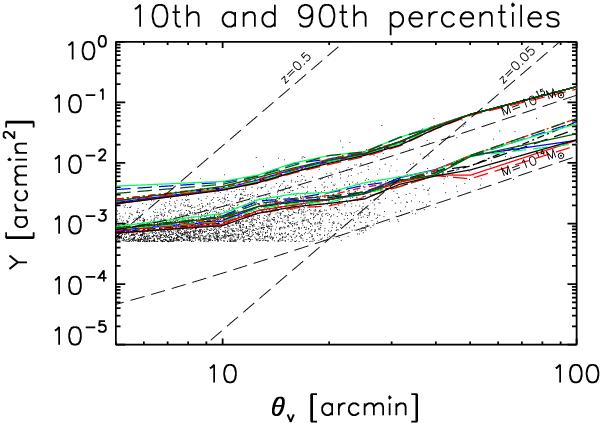
Selection curves for each algorithm in the true Y–true θv plane for SZ Challenge v1. The lower set of curves indicate the 90th percentiles, i.e., the curve above which lie 90% of the detected clusters; the upper set corresponds to the 10th percentile. The colour codes are as in Fig. 1. We see that the Planck selection function depends not just on flux, but also on cluster angular size. Many clusters are at least marginally resolved by Planck, leading to these size effects in the selection fuction. The dashed lines show contours of fixed mass and redshift, as indicated, while the cloud of points shows the distribution of the input catalogue (in fact a subsample of 1 in 4 randomly selected input clusters). We see that small variations in selection curves generate significant yield changes.
Current usage metrics show cumulative count of Article Views (full-text article views including HTML views, PDF and ePub downloads, according to the available data) and Abstracts Views on Vision4Press platform.
Data correspond to usage on the plateform after 2015. The current usage metrics is available 48-96 hours after online publication and is updated daily on week days.
Initial download of the metrics may take a while.