Fig. 1
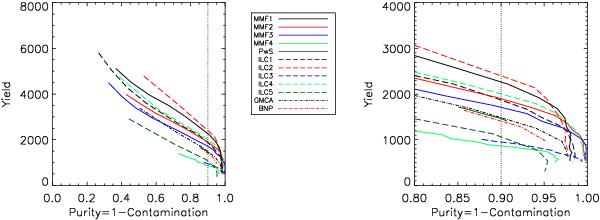
For SZ Challenge v1: yield as a function of global purity. The right handside panel is a zoom on the high-purity region. Each curve is parameterized by the detection threshold of the corresponding algorithm. As discussed in the text, the overall value of the yields should be considered with caution, due to remaining modeling uncertainties (see text). We focus instead on relative yield between algorithms as a measure of performance.
Current usage metrics show cumulative count of Article Views (full-text article views including HTML views, PDF and ePub downloads, according to the available data) and Abstracts Views on Vision4Press platform.
Data correspond to usage on the plateform after 2015. The current usage metrics is available 48-96 hours after online publication and is updated daily on week days.
Initial download of the metrics may take a while.