Fig. 5
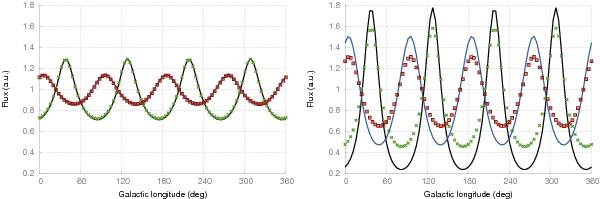
Orbital variation of the CR proton flux along the Sun’s orbit, plotted against longitude (with Sun’s position at 90°). All curves are rescaled to an offset value of 1 for comparison. The black line and green crosses show the variation for an orbit at r = 7.9 kpc and z = 0 for 1 GeV and 100 GeV, respectively. The blue line and red boxes show the same energies for an orbit at r = 5 kpc. The left panel again shows the case of isotropic diffusion, while the right panel has ϵ = 0.01, and the variation is much more pronounced.
Current usage metrics show cumulative count of Article Views (full-text article views including HTML views, PDF and ePub downloads, according to the available data) and Abstracts Views on Vision4Press platform.
Data correspond to usage on the plateform after 2015. The current usage metrics is available 48-96 hours after online publication and is updated daily on week days.
Initial download of the metrics may take a while.