| Issue |
A&A
Volume 547, November 2012
|
|
|---|---|---|
| Article Number | A36 | |
| Number of page(s) | 5 | |
| Section | Planets and planetary systems | |
| DOI | https://doi.org/10.1051/0004-6361/201220167 | |
| Published online | 25 October 2012 | |
Research Note
Exploring the α-enhancement of metal-poor planet-hosting stars. The Kepler and HARPS samples⋆
1
Centro de Astrofísica da Universidade do Porto,
Rua das Estrelas,
4150-762
Porto,
Portugal
e-mail: This email address is being protected from spambots. You need JavaScript enabled to view it.
2
Instituto de Astrofísica de Canarias, 38200 La Laguna, Tenerife, Spain
3 Departamento de Física e Astronomia, Faculdade de Ciências da
Universidade do Porto, Portugal
4
Departamento de Astrofísica, Universidad de La
Laguna, 38206 La
Laguna, Tenerife,
Spain
5
Observatoire de Genève, Université de Genève,
51 Ch. des
Mailletes, 1290
Sauverny,
Switzerland
6 Byurakan Astrophysical Observatory, 0213 Byurakan, Aragatsotn province, Armenia
7
Department of General Physics and Astrophysics, Yerevan State
University, 1 Alex
Manoogian, 0025
Yerevan,
Armenia
8 Isaac Newton Institute of Chile, Armenian Branch, 0213 Byurakan, Aragatsotn province, Armenia
Received: 4 August 2012
Accepted: 27 September 2012
Abstract
Recent studies have shown that at low metallicities Doppler-detected planet-hosting stars tend to have high α-content and to belong to the thick disk. We used the reconnaissance spectra of 87 Kepler planet candidates and data available from the HARPS planet search survey to explore this phenomenon. Using the traditional spectroscopic abundance analysis methods, we derived Ti, Ca, and Cr abundances for the Kepler stars. In the metallicity region –0.65 < [Fe/H] < –0.3 dex, the fraction of Ti-enhanced thick-disk HARPS planet harboring stars is 12.3 ± 4.1%, and for their thin-disk counterparts this fraction is 2.2 ± 1.3%. Binomial statistics give a probability of 0.008 that this could have occurred by chance. Combining the two samples (HARPS and Kepler) reinforces the significance of this result (P ~ 99.97%). Since most of these stars harbor small sized or low-mass planets we can assume that, although terrestrial planets can be found in a low-iron regime, they are mostly enhanced by α-elements. This implies that early formation of rocky planets could start in the Galactic thick disk, where the chemical conditions for their formation are more favorable.
Key words: stars: abundances / planetary systems
Table with chemical abundances is only available at the CDS via anonymous ftp to cdsarc.u-strasbg.fr (130.79.128.5) or via http://cdsarc.u-strasbg.fr/viz-bin/qcat?J/A+A/547/A36
© ESO, 2012
1. Introduction
Since the first discovery of an exoplanet around a solar-like star (Mayor & Queloz 1995), more than 750 exoplanets have been discovered and more than 2300 planet candidates have been announced (Batalha et al. 2012). Despite the rather large number, we still have to be content with a very small number of low-metallicity planet-hosting stars (PHSs) because of the well-established metal-rich nature of the PHSs, especially giant PHSs (Gonzalez 1998; Gonzalez et al. 2001; Santos et al. 2001, 2004; Fischer & Valenti 2005; Neves et al. 2009; Johnson et al. 2010; Sousa et al. 2011b; Adibekyan et al. 2012b). Study of the chemical properties of metal-poor (iron-poor) PHSs is very important for understanding if there is any chemical composition requirements for their formation.
Recently, some studies have shown that iron-poor PHSs tend to be enhanced by α-elements (e.g. Haywood 2008, 2009; Kang et al. 2011; Adibekyan et al. 2012a). This enhancement suggests that in a metal-poor regime most of the PHSs belong to the Galactic thick disk (Haywood 2008, 2009; Adibekyan et al. 2012a). However, further interpretations of this result have been ambiguous. Haywood (2008, 2009) suggests that metallicity is not the causative parameter that determines the presence of giant planets around Sun-like stars, and there might be another parameter linked to galactocentric radius (such as density of H2). Alternatively, Adibekyan et al. (2012a) proposes that a certain chemical composition, and not the Galactic place birth of the stars, is the determinating factor for iron-poor PHSs to lie in the high-α/thick-disk region (see also discussion in Gonzalez 2009).
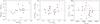 |
Fig. 1 Comparison of the stellar parameters from B12 to those derived in this work by traditional spectroscopic analysis technique (black dots) and with the TMCalc code (red crosses). |
The iron content is used as a proxy for the overall metallicity of planet hosts in most studies. However, iron is not the only abundant refractory element in the solar system. There are other fairly abundant elements (e.g. Mg and Si) with condensation temperatures comparable to iron (Lodders 2003) that are very important contributors to the composition of dust in planet-forming regions (e.g. Gonzalez 2009). The α-enhancement of iron-poor PHSs is not unexpected, since a high [X/Fe] ratio means higher “total metallicity” and is moreover supported by the theoretical studies using the core-accretion model (e.g. Ida & Lin 2004; Mordasini et al. 2012). Interestingly, Adibekyan et al. (2012a) show that not only stars hosting giant planets, but also Neptune- and super-Earth class planet hosts are also enhanced by α-elements in the metal-poor regime. This indicates that despite the observed correlation between stellar metallicity ([Fe/H]) and presence of low-mass planets is very weak (e.g. Udry et al. 2006; Sousa et al. 2008; Ghezzi et al. 2010; Mayor et al. 2011; Sousa et al. 2011b; Buchhave et al. 2012; Adibekyan et al. 2012b), there is a special chemical composition required for their formation.
Buchhave et al. (2012, hereafter B12) report spectroscopic metallicities of 152 stars harboring 226 exoplanet candidates discovered by the Kepler mission (Borucki et al. 2010), including 175 objects that are smaller than 4 R⊕. With precise stellar parameters they also provide the unprocessed extracted spectra (only the wavelength region rangs roughly 260 Å) used in their analysis. In this paper we have used these spectra and data from Adibekyan et al. (2012b) to explore the possible chemical anomalies (i.e., α-enhancement) described above.
2. The sample and atmospheric parameters
Recently, B12 used the reconnaissance spectra obtained by the Kepler Follow-up Observing Program to derive the stellar parameters for 152 stars (Kepler Objects of Interest – KOI) hosting 226 planet candidates. These stars were chosen out of about 560 KOIs (having reconnaissance spectra) as not very cool,  K, and not fast rotators vsini < 40 km s-1, which allowed them to get more robust results. The spectra used in B12 were obtained with high-resolution spectrographs on medium-class telescopes, and some highest priority planet candidates (those of nearly Earth-sized) were observed with the HIRES spectrograph (Vogt et al. 1994) on the 10-m Keck I telescope at Mauna Kea, Hawaii. The spectra have low/modest signal-to-noise ratio (S/N; S/N per pixel > 15). We refer the reader to B12 for more details.
Our main goal is to study the chemical abundances of individual elements of planet-hosting dwarf stars with standard spectroscopic analysis techniques using equivalent widths (EW) of the spectral lines. This technique requires higher S/N and lower vsini than used in B12, where the stellar parameters were determined by matching an observed spectrum to a library grid of synthetic model spectra. For this reason we first selected only stars with vsini < 10 km s-1 and log g > 4.0 dex, which reduced the sample to 117 KOIs. Because many of these objects have multiple observations with different instruments, we were not limited in S/N (there is no numerical criterion), but during determination of chemical abundances we selected only those with reliable EW measurements (see Sect. 3). Our final sample, for which we were able to determine elemental abundances, consists of 87 PHSs with 146 planet candidates.
2.1. Testing the stellar parameters
As mentioned before, in B12 the stellar parameters ( , log g, [m/H], and vsini) were derived by cross-correlating the observed spectra against synthetic model spectra. To test how these parameters match those obtained with traditional techniques using EWs, we selected the stars with highest S/N observed with Keck I (41 stars). For these stars we applied two different techniques to derive the stellar atmospheric parameters.
In the first approach the spectroscopic stellar parameters and metallicities were derived based on the EWs of the Fe i and Fe ii weak lines by imposing excitation and ionization equilibrium (e.g. Sousa et al. 2011b). The spectroscopic analysis was completed assuming local thermodynamic equilibrium (LTE) with a grid of Kurucz atmosphere models (Kurucz 1993), and making use of a recent version of the MOOG1 radiative transfer code (Sneden 1973). The quality of these spectra was high enough to measure the EW using the ARES2 code (Sousa et al. 2007). Unfortunately, in the used spectral window there are 25 Fe i and 5 Fe ii lines at most, which is not always enough to get precise parameters.
In the second approach, we used the TMCalc code (Sousa et al. 2012). This code uses a recent line-ratio calibration (Sousa et al. 2010) to estimate the Teff. Then, it uses a new direct spectroscopic calibration based on weak Fe i lines, which are expected to be less dependent on surface gravity and microturbulence to estimate [Fe/H]. The code was combined with ARES to estimate both the spectroscopic stellar Teff and [Fe/H]. With this code we determined the mentioned parameters for 28 KOIs.
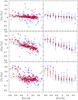 |
Fig. 2 [X/Fe] abundance ratios against [Fe/H] for the stars with and without planets from HARPS and Kepler surveys. The symbols and error bars (right panel) indicate the average and standard deviation, respectively, of each bin (0.05 dex). The red squares and blue crosses represent stars with planets detected by HARPS and Kepler, respectively. The black dots refer to stars without a planetary companion. |
Comparing the stellar parameters derived with the two methods we found strong discrepancies for the majority of the stars. This is not surprising because the first method is designed to use a long list of Fe i and Fe ii lines. However, we found good agreement between the [Fe/H]3 and Teff determined with the TMCalc code and B12, except for three stars for which the differences in Teff are higher than 250 K. The comparison of these two parameters (except the three mentioned stars) is shown in Fig. 1. As can be seen, the two results agree well, although it seems there is a small systematic trend at higher metallicities (see also Torres et al. 2012). The standard deviations of the differences of Teff and [Fe/H] between the two estimations are σ(Teff) = 82 K and σ([Fe/H]) = 0.07 dex (25 stars). This independent analysis also shows that the TMCalc code works well and can be very useful for determining precise parameters for large amounts of data.
Assuming that the most reliable parameters were obtained for the stars for which our two methods gave similar results ( | Δ | < 100 K and | Δ[Fe/H] | < 0.1 dex), we compared our atmospheric parameters (obtained with the first method) with those obtained in B12. The comparison for these 16 PHSs is presented in Fig. 1. As can be seen, the two results agree well. The standard deviations of the differences of the stellar parameters derived in B12 and with our first method are σ(Teff) = 100 K, σ([Fe/H]) = 0.09 dex, and σ(log g) = 0.16 dex (16 stars). Based on this consistency we use the atmospheric parameters from B12 in our analysis here.
2.2. Microturbulence
The traditional spectroscopic abundance analysis methods using the MOOG code and a grid of Kurucz model atmospheres requires four stellar parameters: [Fe/H], , log g, and microturbulence velocity ( ). B12 provides only the first three atmospheric parameters. Earlier studies of FGK dwarfs have shown that depends on and log g (e.g. Nissen 1981; Reddy et al. 2003; Allende Prieto et al. 2004). Using the spectroscopic of 1111 FGK dwarf stars from the high-S/N and high-resolution HARPS data (Sousa et al. 2008, 2011b,a), we derive the following expression
 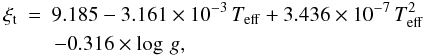 (1)expecting an rms error of 0.18 km s-1. Here the is in km s-1, and Teff and log g are in their traditional units. The stars in the sample have ranging from 4500 to 6500 K, log g ranging from 3 to 5 dex, and [Fe/H] ranging from –1.4 to 0.5 dex. We use this expression to calculate the ξt for our Kepler sample stars.
3. Refractory elements in planet-hosting stars
The reconnaissance spectra used in this work cover from about 70 to 260 Å around λ ≈ 5200 Å (see B12 for more details). In this spectral range we have four Ti i and one Ti ii line, five Cr i lines, and two Ca i lines at most (for more details about the lines see Neves et al. 2009). For these lines the EWs were measured using a Gaussian fitting procedure within the IRAF 4 splot task. After measuring the EWs of spectral lines for the three elements, the chemical abundances were derived using an LTE analysis with the Sun as reference point with the MOOG spectral synthesis code (Sneden 1973) and a grid of Kurucz ATLAS9 plane-parallel model atmospheres (Kurucz 1993). The reference abundances used in the analysis were taken from Anders & Grevesse (1989).
We derived the average abundances of the stars from all the available spectra taking their quality into account. Additionally, we removed the lines that were very different from the average value. We are inclined to trust the results obtained from the spectra with higher S/N. For some stars there was only one low-quality spectra available with unreliable abundance results (very different abundances from different lines). We excluded these stars from our sample. At the end of this procedure, we finished with 75 KOIs with Cr abundances, 75 KOIs with Ca, and 86 KOIs with Ti abundances. The final sample consists of 87 KOIs with at least one abundance result.
In Fig. 2 we show the [X/Fe] abundance trends relative to [Fe/H] for the total Kepler sample. For comparison, the stars hosting planets and field dwarfs without planets from the sample of Adibekyan et al. (2012a; HARPS sample) are also depicted. In the same plot the averages and standard deviations of [X/Fe] ratios for each [Fe/H] bin (0.05 dex) are also displayed (right panels). These figures obviously show that the Kepler and HARPS PHSs have the same behavior, although the scatter of Kepler stars is much higher. We note that the methodology used for deriving the chemical abundances is exactly the same for both samples (Kepler and HARPS), and the errors due to the applied methodology (the errors induced by uncertainties in the model atmosphere parameters) are the same. This means that the heavy scatter found for Kepler PHSs is not likely to be astrophysical, and it indicates the low precision of the EW measurements. The average scatter for KOIs in the metallicity region − 0.1 to 0.5 dex (in this regime the astrophysical scatter due to the Galactic chemical evolution is low) is about 0.11, 0.10, and 0.10 dex for Cr, Ca, and Ti, respectively. For comparison the same scatters for HARPS PHSs are 0.02, 0.05, and 0.04 dex for Cr, Ca, and Ti, respectively, and for non-host stars these values are 0.03, 0.04, and 0.04 dex.
For the Kepler stars the line-to-line scatter errors we estimated are about 0.09, 0.10, and 0.10 dex for [Cr/H], [Ca/H], and [Ti/H], respectively. Taking the errors induced by uncertainties into account in the model atmosphere parameters (0.03, 0.04, and 0.04 for [Cr/H], [Ca/H], and [Ti/H]) and the errors in metallicities (maximum 0.08 dex), we can expect the error of about 0.13, 0.13, and 0.12 dex for [Cr/Fe], [Ca/Fe], and [Ti/Fe] ratios, respectively.
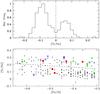 |
Fig. 3 The thin/thick separation histogram after subtracting the separation curve based on HARPS data (top). [Ti/Fe] against [Fe/H] for the metal-poor stars (bottom). The black dashed line indicates the separation between the thin- and thick disks. The blue crosses represent Kepler planet-hosting candidates. The red squares refer to the Jovian hosts and green triangles refer to the stars exclusively hosting Neptunians and super-Earths detected by HARPS. The black dots refer to the stars without a planetary companion. |
4. Discussion and conclusions
As already noted, the main goal of this work is to study the behavior of Kepler PHSs at low metallicities, i.e., how these planet hosts are enhanced by α-elements (relative to iron). In this study we used Ti as a proxy of overall α-content. We chose not to combine Ca with Ti, because the separation between the thin and thick disks based on the [Ca/Fe] is not as clear as for [Ti/Fe] (e.g. Bensby et al. 2003; Neves et al. 2009; Adibekyan et al. 2012a). In Fig. 3 (bottom), we plot the distribution of stars both from Adibekyan et al. (2012b) and KOIs from this sample in the [Ti/Fe] vs. [Fe/H] space. As can be seen, the stars are clearly separated into two groups according to their Ti content. The top panel of Fig. 3 shows the separation histogram after subtracting the thin-thick disk separation curve. We note that this separation is based only on HARPS sample stars.
As already found (Adibekyan et al. 2012b) in the metal-poor regime, the frequency of PHSs in the chemically defined thick disk is higher than in the thin disk (for details of the chemical separation see Adibekyan et al. 2011). Eight stars out of 65 are hosting planets (12.3 ± 4.1%) above the separation line, and only three stars out of 136 harbour planets (2.2 ± 1.3%) in the thin disk (low Ti-content). Because we have both the number of stars hosting planets and stars without detected planets from the same survey (HARPS), we can calculate the probability that 8 (or more) out of 11 PHSs found in this metallicity range belong to the thick disk (Ti-enhanced). The binomial statistics give a probability of 0.008 that this could have occurred by chance.
In the metallicity region –0.65 < [Fe/H] < −0.3 dex, there are six Kepler PHSs, five of which lie above the [Ti/Fe] separation line (see Fig. 3). If we assume that the Kepler targets also have a similar distribution in the [Ti/Fe] vs. [Fe/H] space5, as we observed for HARPS (32% stars lie above and 68% bellow the separation line), we can see that the probability of finding five (or more) out of six KOIs to be Ti-enhanced is about 1.6%. Moreover, if we combine both samples (13 Ti-enhanced PHSs out of 17) the binomial probability gives a value of 3 × 10⁻⁴. This statistically significant result (3σ) suggests that in the metal-poor regime PHSs tend to have high Ti-content.
Some of the Kepler planetary candidates are expected to be false positives (FPs) that do not turn out to be transiting planets. Two stars in our metal-poor Kepler sample host three planets, one hosts four planets, one hosts five, and only two stars host only one planet. The probability that all our planet candidates that are in the multiple systems are FPs is very low (e.g. Lissauer et al. 2012), and the FP probabilities for the two single-planet candidates are 2% for KOI105.01 and 4% for KOI373.01 (Morton & Johnson 2011). The probability that one of the KOIs or both of them hosts FPs is thus about 6%. If even one of the Kepler planet candidates is an FP, then we have four Ti-enhanced PHS out of five, for which the binomial statistics give a probability of about 4% that this could have occurred by chance. Taking the 6% FP probability in our sample into account we can calculate a binomial probability of about 98% that metal-poor Kepler planet candidates are really (not randomly) Ti-enhanced. The same statistics give a probability of about 99.96% (≈3σ) for the combined (Kepler and HARPS) sample.
The enhancement of metal-poor PHSs by Ti, suggests that these stars are also enhanced by other α-elements (e.g. Neves et al. 2009; Adibekyan et al. 2012a), including Mg and Si, which may be very important contributors to the composition of dust in planet-forming regions and represent the principal components of rocky-type planets (e.g. Gonzalez 2009; Adibekyan et al. 2012b).
B12 suggested that small planets may be widespread in the disk of our Galaxy, with no special requirement of enhanced metallicity for their formation. Interestingly, all six KOIs harbor small-size planets with a radius smaller than 4 R⊕. We note that six out of eleven PHSs (in the low-metallicity region) from the HARPS sample exclusively host Neptunes or super-Earth-class planets (less than 30 M⊕), and only one lies in the Ti-poor region. The binomial statistics give a probability of about 4 × 10⁻⁴ that ten (or more) out of twelve small/low-mass planet hosts (combined sample) could randomly be Ti-enhanced. Considering the possibility that Kepler planet candidates are FPs, the binomial statistics give a probability of about 99.95% (≈3σ) that Ti-enhancement of small/low-mass planet hosts is not accidental. Our results suggest that, although terrestrial planets can be found in a low-iron regime, they are mostly enhanced by other metals. Moreover, high-α content at low-metallicities also hints that they belong to the Galactic thick disk, which implies that early formation of rocky planets could have started in the Galactic thick disk, where the chemical conditions for their formation are more favorable.
The source code of MOOG2010 can be downloaded at http://www.as.utexas.edu/~chris/moog.html
The ARES code can be downloaded at http://www.astro.up.pt/sousasag/ares
The metallicity in B12 is denoted as [m/H] and represents a mix of metals assumed to be the same as the relative pattern of the abundances in the Sun.
IRAF is distributed by National Optical Astronomy Observatories, operated by the Association of Universities for Research in Astronomy, Inc., under contract with the National Science Foundation, USA.
This can be very rough assumption because of the different fields of Kepler and HARPS.
Acknowledgments
This work was supported by the European Research Council/European Community under the FP7 through Starting Grant agreement number 239953. N.C.S. also acknowledges the support from the Fundação para a Ciência e a Tecnologia (FCT) through program Ciência 2007 funded by FCT/MCTES (Portugal) and POPH/FSE (EC), and in the form of grant PTDC/CTE-AST/098528/2008. V.Zh.A., S.G.S., and E.D.M. are supported by grants SFRH/BPD/70574/2010, SFRH/BPD/47611/2008, and SFRH/BPD/76606/2011 from the FCT (Portugal), respectively. J.I.G.H. and G.I. acknowledge financial support from the Spanish Ministry project MICINN AYA2011-29060 and J.I.G.H. also from the Spanish Ministry of Science and Innovation (MICINN) under the 2009 Juan de la Cierva Program.
References
- Adibekyan, V. Z., Santos, N. C., Sousa, S. G., & Israelian, G. 2011, A&A, 535, L11 [NASA ADS] [CrossRef] [EDP Sciences] [Google Scholar]
- Adibekyan, V. Z., Santos, N. C., Sousa, S. G., et al. 2012a, A&A, 543, A89 [NASA ADS] [CrossRef] [EDP Sciences] [Google Scholar]
- Adibekyan, V. Z., Sousa, S. G., Santos, N. C., et al. 2012b, A&A, 545, A32 [NASA ADS] [CrossRef] [EDP Sciences] [Google Scholar]
- Allen de Prieto, C., Barklem, P. S., Lambert, D. L., & Cunha, K. 2004, A&A, 420, 183 [NASA ADS] [CrossRef] [EDP Sciences] [Google Scholar]
- Anders, E., & Grevesse, N. 1989, Geochim. Cosmochim. Acta, 53, 197 [Google Scholar]
- Batalha, N. M., Rowe, J. F., Bryson, S. T., et al. 2012, ApJS, submitted [arXiv:1202.5852] [Google Scholar]
- Bensby, T., Feltzing, S., & Lundström, I. 2003, A&A, 410, 527 [NASA ADS] [CrossRef] [EDP Sciences] [Google Scholar]
- Borucki, W. J., Koch, D., Basri, G., et al. 2010, Science, 327, 977 [NASA ADS] [CrossRef] [PubMed] [Google Scholar]
- Buchhave, L. A., Latham, D. W., Johansen, A., et al. 2012, Nature, 486, 375 [NASA ADS] [Google Scholar]
- Fischer, D. A., & Valenti, J. 2005, ApJ, 622, 1102 [NASA ADS] [CrossRef] [Google Scholar]
- Ghezzi, L., Cunha, K., Smith, V. V., et al. 2010, ApJ, 720, 1290 [NASA ADS] [CrossRef] [Google Scholar]
- Gonzalez, G. 1998, A&A, 334, 221 [NASA ADS] [Google Scholar]
- Gonzalez, G. 2009, MNRAS, 399, L103 [NASA ADS] [Google Scholar]
- Gonzalez, G., Laws, C., Tyagi, S., & Reddy, B. E. 2001, AJ, 121, 432 [NASA ADS] [CrossRef] [Google Scholar]
- Haywood, M. 2008, A&A, 482, 673 [NASA ADS] [CrossRef] [EDP Sciences] [Google Scholar]
- Haywood, M. 2009, ApJ, 698, L1 [NASA ADS] [CrossRef] [Google Scholar]
- Ida, S., & Lin, D. N. C. 2004, ApJ, 616, 567 [NASA ADS] [CrossRef] [MathSciNet] [Google Scholar]
- Johnson, J. A., Aller, K. M., Howard, A. W., & Crepp, J. R. 2010, PASP, 122, 905 [NASA ADS] [CrossRef] [Google Scholar]
- Kang, W., Lee, S.-G., & Kim, K.-M. 2011, ApJ, 736, 87 [NASA ADS] [CrossRef] [Google Scholar]
- Kurucz, R. 1993, ATLAS9 Stellar Atmosphere Programs and 2 km s-1 grid, Kurucz CD-ROM No. 13, Cambridge, Mass.: Smithsonian Astrophysical Observatory [Google Scholar]
- Lissauer, J. J., Marcy, G. W., Rowe, J. F., et al. 2012, ApJ, 750, 112 [NASA ADS] [CrossRef] [Google Scholar]
- Lodders, K. 2003, ApJ, 591, 1220 [NASA ADS] [CrossRef] [Google Scholar]
- Mayor, M., & Queloz, D. 1995, Nature, 378, 355 [NASA ADS] [CrossRef] [Google Scholar]
- Mayor, M., Marmier, M., Lovis, C., et al. 2011, A&A, submitted [arXiv:1109.2497] [Google Scholar]
- Mordasini, C., Alibert, Y., Benz, W., Klahr, H., & Henning, T. 2012, A&A, 541, A97 [NASA ADS] [CrossRef] [EDP Sciences] [Google Scholar]
- Morton, T. D., & Johnson, J. A. 2011, ApJ, 738, 170 [NASA ADS] [CrossRef] [Google Scholar]
- Neves, V., Santos, N. C., Sousa, S. G., Correia, A. C. M., & Israelian, G. 2009, A&A, 497, 563 [NASA ADS] [CrossRef] [EDP Sciences] [Google Scholar]
- Nissen, P. E. 1981, A&A, 97, 145 [NASA ADS] [Google Scholar]
- Reddy, B. E., Tomkin, J., Lambert, D. L., & Allen de Prieto, C. 2003, MNRAS, 340, 304 [NASA ADS] [CrossRef] [Google Scholar]
- Santos, N. C., Israelian, G., & Mayor, M. 2001, A&A, 373, 1019 [NASA ADS] [CrossRef] [EDP Sciences] [Google Scholar]
- Santos, N. C., Israelian, G., & Mayor, M. 2004, A&A, 415, 1153 [NASA ADS] [CrossRef] [EDP Sciences] [Google Scholar]
- Sneden, C. A. 1973, Ph.D. Thesis, The University of Texas at Austin [Google Scholar]
- Sousa, S. G., Santos, N. C., Israelian, G., Mayor, M., & Monteiro, M. J. P. F. G. 2007, A&A, 469, 783 [NASA ADS] [CrossRef] [EDP Sciences] [Google Scholar]
- Sousa, S. G., Santos, N. C., Mayor, M., et al. 2008, A&A, 487, 373 [NASA ADS] [CrossRef] [EDP Sciences] [MathSciNet] [Google Scholar]
- Sousa, S. G., Alapini, A., Israelian, G., & Santos, N. C. 2010, A&A, 512, A13 [NASA ADS] [CrossRef] [EDP Sciences] [Google Scholar]
- Sousa, S. G., Santos, N. C., Israelian, G., et al. 2011a, A&A, 526, A99 [NASA ADS] [CrossRef] [EDP Sciences] [Google Scholar]
- Sousa, S. G., Santos, N. C., Israelian, G., Mayor, M., & Udry, S. 2011b, A&A, 533, A141 [NASA ADS] [CrossRef] [EDP Sciences] [Google Scholar]
- Sousa, S. G., Santos, N. C., & Israelian, G. 2012, A&A, 544, A122 [NASA ADS] [CrossRef] [EDP Sciences] [Google Scholar]
- Torres, G., Fischer, D. A., Sozzetti, A., et al. 2012, ApJ, 757, 161 [NASA ADS] [CrossRef] [Google Scholar]
- Udry, S., Mayor, M., Benz, W., et al. 2006, A&A, 447, 361 [NASA ADS] [CrossRef] [EDP Sciences] [Google Scholar]
- Vogt, S. S., Allen, S. L., Bigelow, B. C., et al. 1994, in SPIE Conf. Ser. 2198, eds. D. L. Crawford, & E. R. Craine, 362 [Google Scholar]
All Figures
|
Fig. 1 Comparison of the stellar parameters from B12 to those derived in this work by traditional spectroscopic analysis technique (black dots) and with the TMCalc code (red crosses). |
| In the text | |
|
Fig. 2 [X/Fe] abundance ratios against [Fe/H] for the stars with and without planets from HARPS and Kepler surveys. The symbols and error bars (right panel) indicate the average and standard deviation, respectively, of each bin (0.05 dex). The red squares and blue crosses represent stars with planets detected by HARPS and Kepler, respectively. The black dots refer to stars without a planetary companion. |
| In the text | |
|
Fig. 3 The thin/thick separation histogram after subtracting the separation curve based on HARPS data (top). [Ti/Fe] against [Fe/H] for the metal-poor stars (bottom). The black dashed line indicates the separation between the thin- and thick disks. The blue crosses represent Kepler planet-hosting candidates. The red squares refer to the Jovian hosts and green triangles refer to the stars exclusively hosting Neptunians and super-Earths detected by HARPS. The black dots refer to the stars without a planetary companion. |
| In the text | |
Current usage metrics show cumulative count of Article Views (full-text article views including HTML views, PDF and ePub downloads, according to the available data) and Abstracts Views on Vision4Press platform.
Data correspond to usage on the plateform after 2015. The current usage metrics is available 48-96 hours after online publication and is updated daily on week days.
Initial download of the metrics may take a while.