Fig. 1
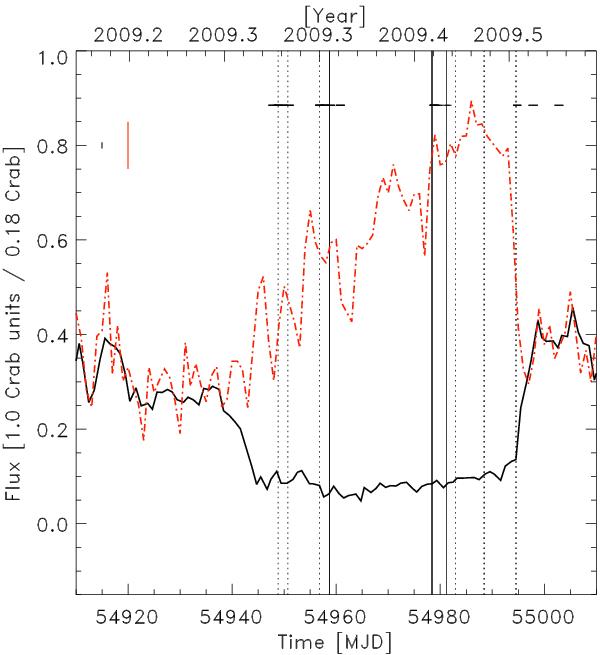
Evolution of the 3 − 12 keV photon flux relative to that of the Crab source (black curve; RXTE-ASM data) and the 15 − 50 keV photon flux with respect to 0.18 times that of the Crab source (red dash-dotted curve; Swift/BAT data). Vertical lines indicate the bursts detected, solid for those with superexpansion and dashed for those without. Three bursts are indistinguishable because they have too short recurrence times to be visible on this scale (see Table 1). The solid horizontal lines indicate the days that the PCA observed 4U 1820-30 under ObsID 94090. The solid vertical lines in the top left corner indicate the 2σ uncertainties.
Current usage metrics show cumulative count of Article Views (full-text article views including HTML views, PDF and ePub downloads, according to the available data) and Abstracts Views on Vision4Press platform.
Data correspond to usage on the plateform after 2015. The current usage metrics is available 48-96 hours after online publication and is updated daily on week days.
Initial download of the metrics may take a while.