Fig. A.1
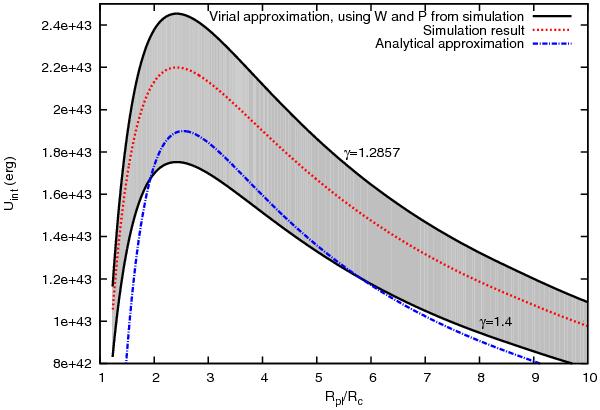
Internal energy of the envelope obtained from the simulation (red dotted line), the internal energy obtained by using the potential energy and the pressure from the simulation in Eq. (A.5) for the two limiting γ (black solid line) and the internal energy obtained by using the fully analytical approximation from Eq. (A.9) and γ = 1.2857 (blue dot-dashed line). The gray area shows where one would expect the internal energy (red dotted line) to be.
Current usage metrics show cumulative count of Article Views (full-text article views including HTML views, PDF and ePub downloads, according to the available data) and Abstracts Views on Vision4Press platform.
Data correspond to usage on the plateform after 2015. The current usage metrics is available 48-96 hours after online publication and is updated daily on week days.
Initial download of the metrics may take a while.