Fig. 13
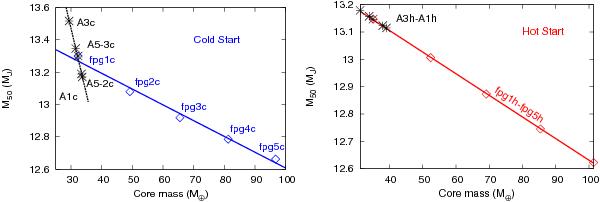
M50 as a function of the core mass for different dust-to-gas ratios and different Ṁmax. The left panel shows the results for a cold start, while the right panel is for a hot start. The black stars correspond to the runs with different Ṁmax, while the diamonds correspond to the runs with different dust-to-gas ratios.
Current usage metrics show cumulative count of Article Views (full-text article views including HTML views, PDF and ePub downloads, according to the available data) and Abstracts Views on Vision4Press platform.
Data correspond to usage on the plateform after 2015. The current usage metrics is available 48-96 hours after online publication and is updated daily on week days.
Initial download of the metrics may take a while.