Fig. 12
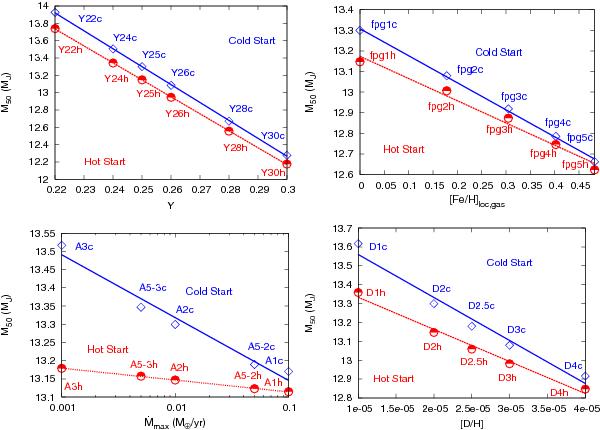
Masses at which 50% of the deuterium has been burned by 1010 years. Upper row, left: varied helium fraction. Right: varied metallicities. Lower row, left: varied maximum gas accretion rates. Right: varied deuterium abundances. The red dashed line shows the fitted functions for the hot start objects (lower line in all plots), while the fits for the cold start objects are plotted in a blue solid line (upper line in all plots). The blue diamonds show the positions of M50 in the cold start runs, while the red semi-filled circles show the positions of M50 for the hot start runs.
Current usage metrics show cumulative count of Article Views (full-text article views including HTML views, PDF and ePub downloads, according to the available data) and Abstracts Views on Vision4Press platform.
Data correspond to usage on the plateform after 2015. The current usage metrics is available 48-96 hours after online publication and is updated daily on week days.
Initial download of the metrics may take a while.