Fig. 10
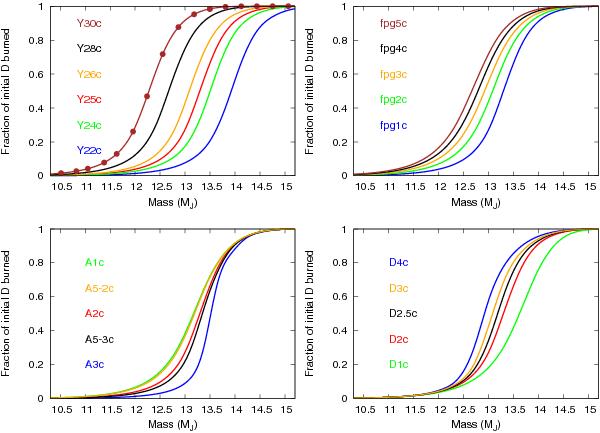
Fraction of the initial deuterium burned as a function of mass until the end of the simulation (1010 years) for cold start objects. Top left: results for different helium fractions. Top right: results with different dust-to-gas ratios (or metallicities). Bottom left: results for different maximum gas accretion rates. Bottom right: results for different deuterium abundances. The uppermost run names in the plots correspond to the leftmost curves, the next lower run names correspond to the second leftmost curves etc. For the Y30 run in the upper left panel the positions of the individual mass runs are indicated with filled brown circles. For the sake of clarity we omitted plotting the individual mass run positions for all other runs. Instead a spline function was plotted through the individual mass run positions.
Current usage metrics show cumulative count of Article Views (full-text article views including HTML views, PDF and ePub downloads, according to the available data) and Abstracts Views on Vision4Press platform.
Data correspond to usage on the plateform after 2015. The current usage metrics is available 48-96 hours after online publication and is updated daily on week days.
Initial download of the metrics may take a while.