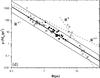
Fig. 4
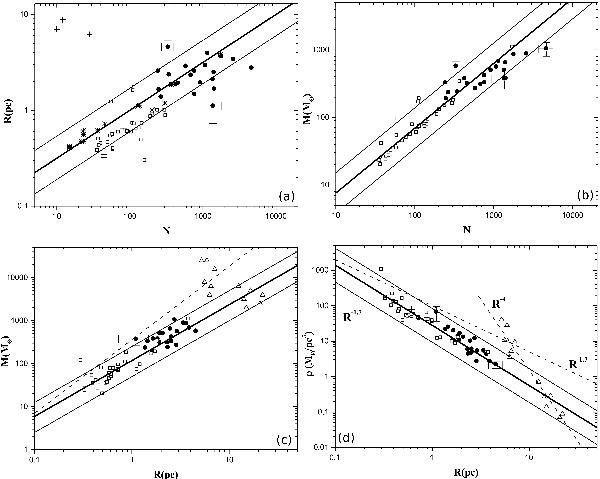
Comparing our objects (filled circles) with embedded clusters (open squares) studied by LL03 and other samples. Representative error bars are used in a few data points, for illustration. a) Radius of the cluster as a function of number of members. Both our sample and the embedded clusters follow the same dependence R ∝ N0.5 (thick line) found for the stellar clusters (asterisks) studied by Carpenter (2000). Thin lines indicate the limits suggested by Adams et al. (2006). The results obtained by Piskunov et al. (2007) for three objects of our sample (crosses) are used to illustrate differences in the cluster size definition. b) Mass of the cluster as a function of number of members showing the same dependence M ∝ N1 for our sample and embedded clusters (thick line), with limits scaled by a factor ~2 (thin lines). c) Mass-radius dependence showing a mean distribution of M ~ 118 R1.3 (tick line) that spreads by a factor 2 (thin lines). The parameters of massive (“leak”) exposed clusters (triangles) are also plotted, as is the dependence M = 359 R1.7 suggested by Pfalzner (2011) for the embedded clusters (dashed line). d) Volumetric density as a function of radius, showing the dependence ρ = 28 R-1.7 presented by our sample and LL03 data (thick line), limited by thin lines that are scaled by a factor 2. Dashed lines represent the relations proposed by Pfalzner (2011).
Current usage metrics show cumulative count of Article Views (full-text article views including HTML views, PDF and ePub downloads, according to the available data) and Abstracts Views on Vision4Press platform.
Data correspond to usage on the plateform after 2015. The current usage metrics is available 48-96 hours after online publication and is updated daily on week days.
Initial download of the metrics may take a while.