Fig. 21
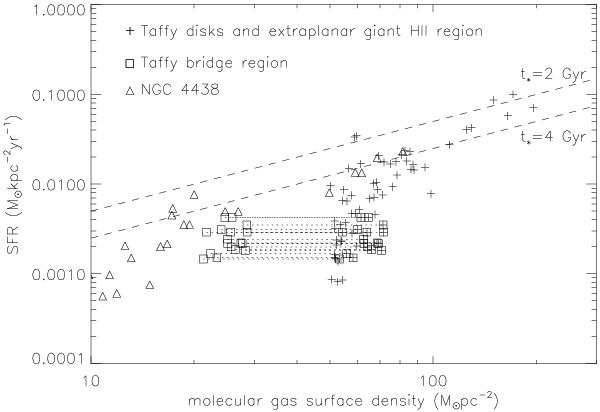
Star formation rate based on the FUV and 24 μm emission as a function of the molecular gas surface density. The crosses are based on X = 1020 cm-2 (K km s-1)-1, which is half of the Galactic value. The bridge region outside the giant Hii region near UGC 12915 are marked as squares with crosses. Squares without crosses correspond to a 2.5 times lower X factor as suggested by Zhu et al. (2007). Data of NGC 4438 are shown as triangles. The dashed lines correspond to constant star formation timescales of 2 and 4 Gyr.
Current usage metrics show cumulative count of Article Views (full-text article views including HTML views, PDF and ePub downloads, according to the available data) and Abstracts Views on Vision4Press platform.
Data correspond to usage on the plateform after 2015. The current usage metrics is available 48-96 hours after online publication and is updated daily on week days.
Initial download of the metrics may take a while.