Fig. 8
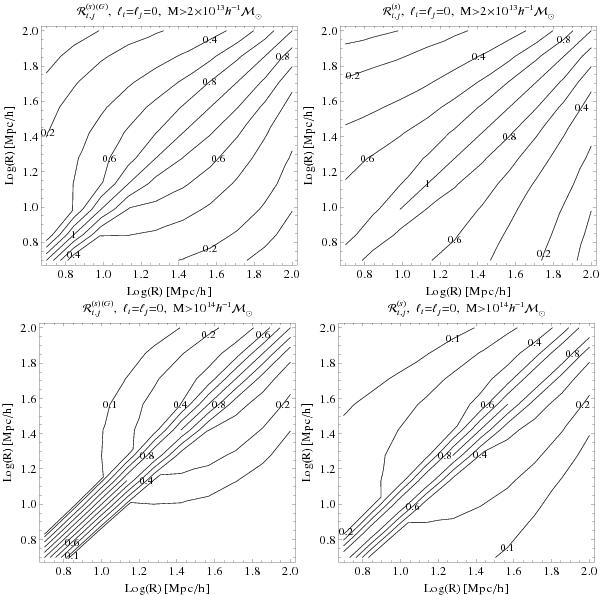
Contour plots for the redshift-space correlation matrices
 ,
defined as in Eq. (41). There are
ten distance bins, over
5 < r < 100 h-1 Mpc,
equally spaced in log (r), as in previous figures. We
considered halos in the redshift range
0 < z < 0.8,
within an angular window of 50 deg2, above the mass thresholds
M > 2 × 10¹³ h-1 M⊙
in the upper row, and
M > 1014 h-1 M⊙
in the lower row. Left panels: correlation
matrix
,
defined as in Eq. (41). There are
ten distance bins, over
5 < r < 100 h-1 Mpc,
equally spaced in log (r), as in previous figures. We
considered halos in the redshift range
0 < z < 0.8,
within an angular window of 50 deg2, above the mass thresholds
M > 2 × 10¹³ h-1 M⊙
in the upper row, and
M > 1014 h-1 M⊙
in the lower row. Left panels: correlation
matrix  associated with the Gaussian part (34) of the covariance matrix. Right panels: full
correlation matrix, associated with the full matrix (33).
associated with the Gaussian part (34) of the covariance matrix. Right panels: full
correlation matrix, associated with the full matrix (33).
Current usage metrics show cumulative count of Article Views (full-text article views including HTML views, PDF and ePub downloads, according to the available data) and Abstracts Views on Vision4Press platform.
Data correspond to usage on the plateform after 2015. The current usage metrics is available 48-96 hours after online publication and is updated daily on week days.
Initial download of the metrics may take a while.