Fig. C.1
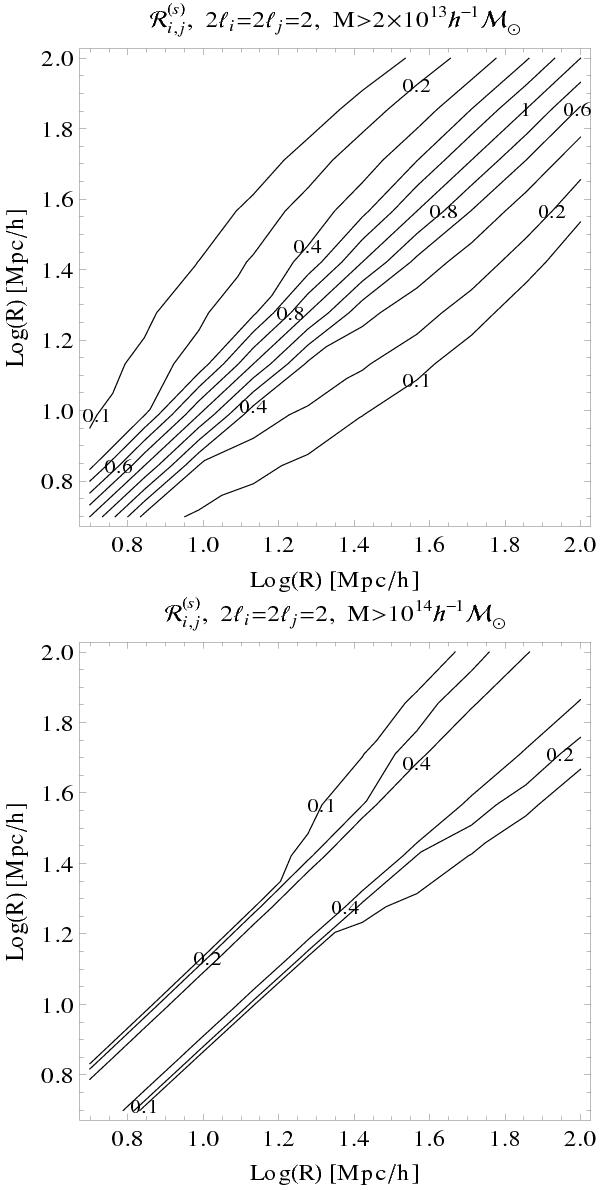
Contour plots for the redshift-space auto-correlation matrices
 ,
defined as in Eq. (41), for the
“2ℓ = 2” redshift-space correlation studied in Sect. 4.3. We considered the same cases (distance
bins, redshift interval, and mass thresholds) as in Fig. 8, where we plotted the auto-correlation matrices of the
monopole term of the redshift-space correlation.
,
defined as in Eq. (41), for the
“2ℓ = 2” redshift-space correlation studied in Sect. 4.3. We considered the same cases (distance
bins, redshift interval, and mass thresholds) as in Fig. 8, where we plotted the auto-correlation matrices of the
monopole term of the redshift-space correlation.
Current usage metrics show cumulative count of Article Views (full-text article views including HTML views, PDF and ePub downloads, according to the available data) and Abstracts Views on Vision4Press platform.
Data correspond to usage on the plateform after 2015. The current usage metrics is available 48-96 hours after online publication and is updated daily on week days.
Initial download of the metrics may take a while.