Fig. 2
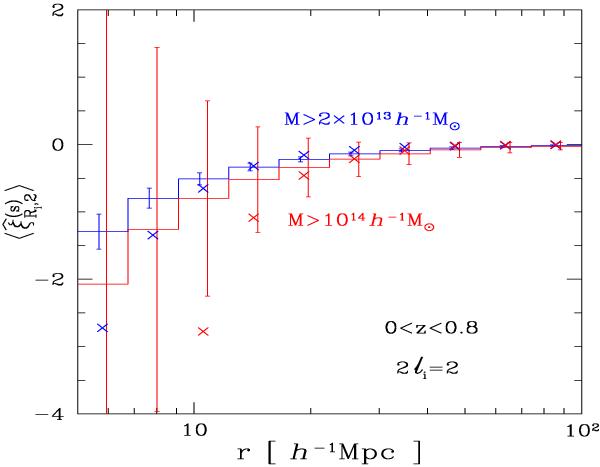
“2ℓ = 2” redshift-space halo correlation
 . As in Fig. 1, we considered ten comoving distance bins, within
5 < r < 100 h-1 Mpc,
equally spaced in log (r), and counted all halos above the
thresholds M ∗ = 2 × 10¹³ and
1014 h-1 M⊙,
within the redshift interval
0 < z < 0.8. We
compare our analytical results with numerical simulations (crosses). The
3 − σ error bars (slightly shifted to the left and to the right
for the real-space and redshift-space correlations) are obtained from the analytical
covariance matrices derived in Sect. 4.
. As in Fig. 1, we considered ten comoving distance bins, within
5 < r < 100 h-1 Mpc,
equally spaced in log (r), and counted all halos above the
thresholds M ∗ = 2 × 10¹³ and
1014 h-1 M⊙,
within the redshift interval
0 < z < 0.8. We
compare our analytical results with numerical simulations (crosses). The
3 − σ error bars (slightly shifted to the left and to the right
for the real-space and redshift-space correlations) are obtained from the analytical
covariance matrices derived in Sect. 4.
Current usage metrics show cumulative count of Article Views (full-text article views including HTML views, PDF and ePub downloads, according to the available data) and Abstracts Views on Vision4Press platform.
Data correspond to usage on the plateform after 2015. The current usage metrics is available 48-96 hours after online publication and is updated daily on week days.
Initial download of the metrics may take a while.