Fig. 5
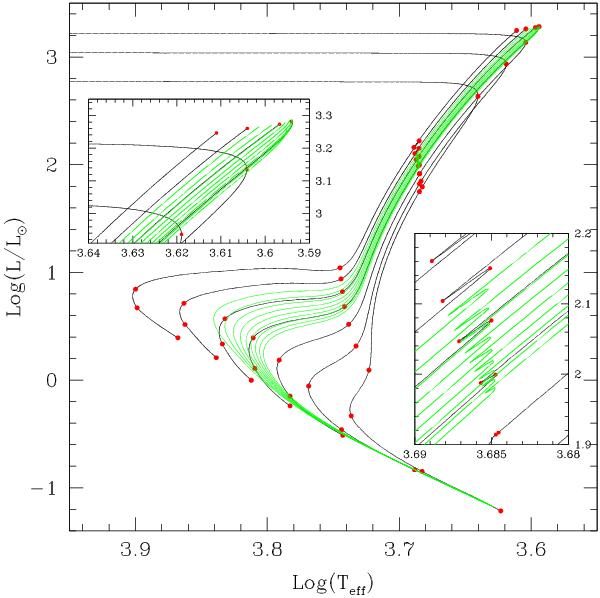
Set of evolutionary tracks (black lines) for stars between 1.1 (hottest track) and 0.5 M⊙ (coolest track) with Y = 0.245, Z = 9.3 × 10⁻⁴, and [α/Fe] = +0.3, plotted at ΔM = 0.1 M⊙ intervals. Red points are the EEPs for each track, while green lines are isochrones, from left to right, between 7 and 15 Gyr, in steps of 1 Gyr. Inner panels are zoom-ins to the RGB tip (left) and RGB bump (right).
Current usage metrics show cumulative count of Article Views (full-text article views including HTML views, PDF and ePub downloads, according to the available data) and Abstracts Views on Vision4Press platform.
Data correspond to usage on the plateform after 2015. The current usage metrics is available 48-96 hours after online publication and is updated daily on week days.
Initial download of the metrics may take a while.