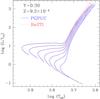
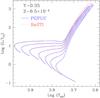
Fig. 4
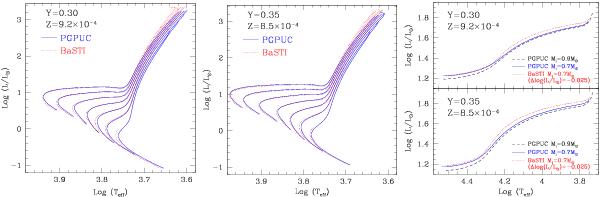
Comparison between PGPUC and BaSTI results for non-standard chemical compositions. Left panel: evolutionary tracks with Y = 0.30 and Z = 9.2 × 10⁻⁴. Middle panel: evolutionary tracks with Y = 0.35 and Z = 8.5 × 10⁻⁴. Right panels: ZAHB loci for Y = 0.30 and Z = 9.2 × 10⁻⁴ (upper panel) and Y = 0.35 and Z = 8.5 × 10⁻⁴ (lower panel), where for comparison BaSTI ZAHB loci are moved Δlog (L/L⊙) = −0.025. PGPUC ZAHB loci are shown for progenitor masses of Mi = 0.7 M⊙ and Mi = 0.9 M⊙.
Current usage metrics show cumulative count of Article Views (full-text article views including HTML views, PDF and ePub downloads, according to the available data) and Abstracts Views on Vision4Press platform.
Data correspond to usage on the plateform after 2015. The current usage metrics is available 48-96 hours after online publication and is updated daily on week days.
Initial download of the metrics may take a while.