Fig. A.2
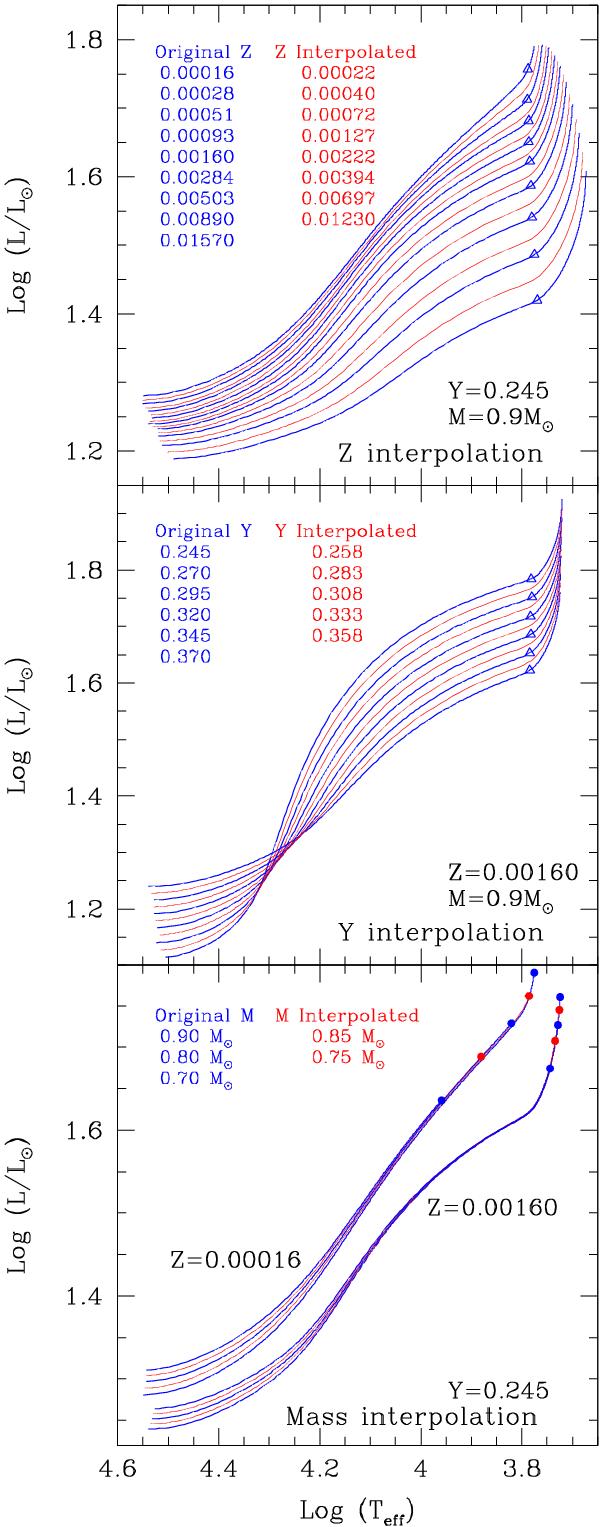
Interpolated ZAHB loci (red lines) from the original theoretical set of ZAHB loci (blue lines). Open triangles show the locus where the convective envelope dissapears. Upper panel: Z interpolation (Z increases from top to bottom) with constant Y = 0.245 and Mi = 0.9 M⊙. Middle panel: Y interpolation (Y increases from bottom to top at the red ZAHB and inversely at the blue ZAHB) with constant Z = 0.0016 and Mi = 0.9 M⊙. Bottom panel: Mi (Mi increases from bottom to top at the blue ZAHB) with two constant Z (Z = 0.0016 and Z = 0.00016) and Y = 0.245. Dots are the initial points for each ZAHB locus, with the mass increasing from bottom to top.
Current usage metrics show cumulative count of Article Views (full-text article views including HTML views, PDF and ePub downloads, according to the available data) and Abstracts Views on Vision4Press platform.
Data correspond to usage on the plateform after 2015. The current usage metrics is available 48-96 hours after online publication and is updated daily on week days.
Initial download of the metrics may take a while.