Fig. A.1
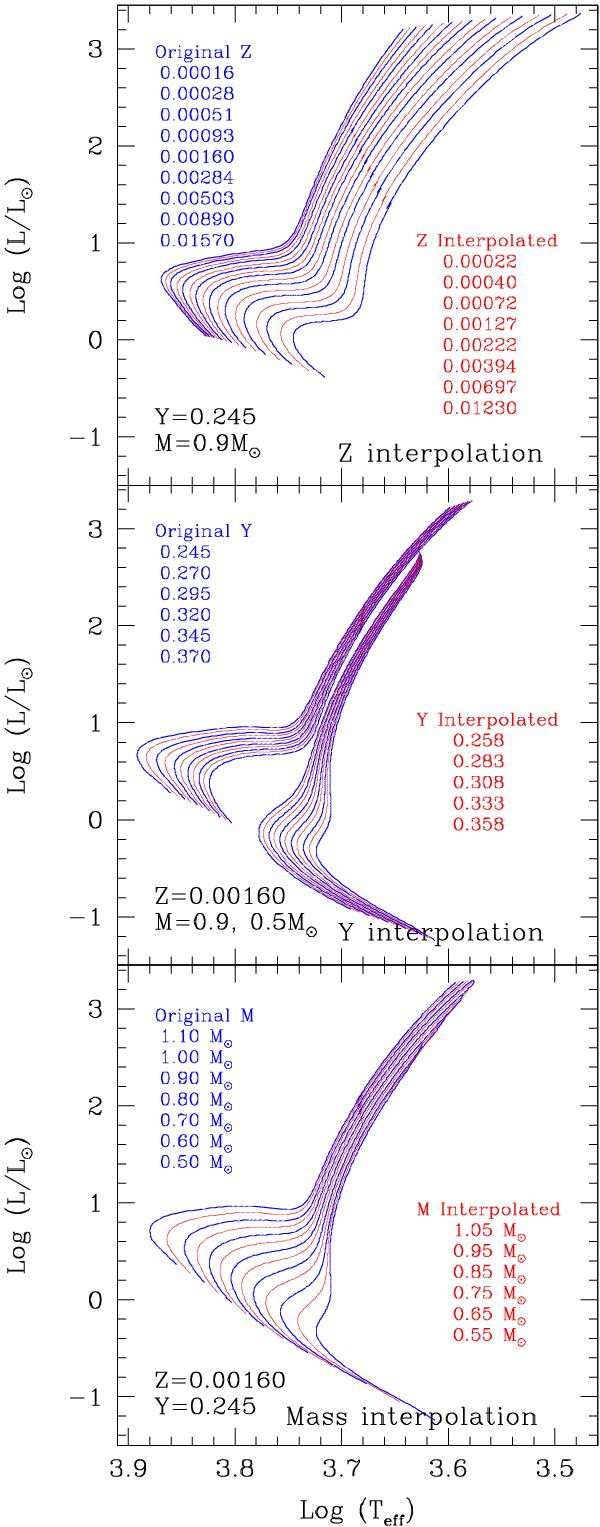
Interpolated evolutionary tracks (red lines) from the original theoretical set of evolutionary tracks (blue lines). Upper panel: metallicity interpolation (metallicity increases from left to right) with constant helium abundance Y = 0.245 and mass of 0.9 M⊙. Middle panel: helium interpolation (helium increases from right to left) with constant metallicity Z = 0.0016 and masses of 0.9 (hotter) and 0.5 M⊙ (cooler). Bottom panel: mass interpolation (mass increases from right to left) with constant metallicity Z = 0.0016 and helium abundance Y = 0.245.
Current usage metrics show cumulative count of Article Views (full-text article views including HTML views, PDF and ePub downloads, according to the available data) and Abstracts Views on Vision4Press platform.
Data correspond to usage on the plateform after 2015. The current usage metrics is available 48-96 hours after online publication and is updated daily on week days.
Initial download of the metrics may take a while.