Free Access
Fig. C.1
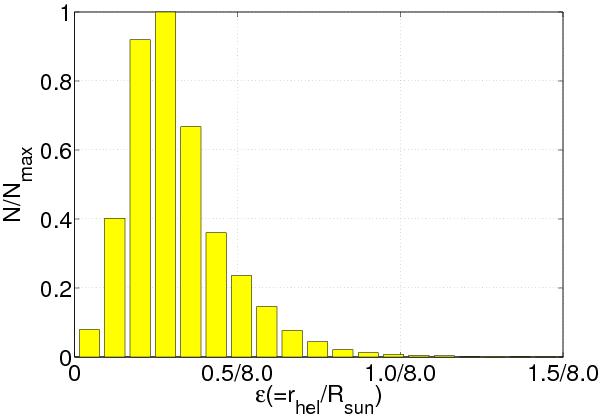
Distance distribution for the selected sample of stars. The number is normalized to the highest value to place the peak position at 1. The x axis shows distances divided by the adopted solar position (to better illustrate the parameter ε for which the adopted approximations hold).
Current usage metrics show cumulative count of Article Views (full-text article views including HTML views, PDF and ePub downloads, according to the available data) and Abstracts Views on Vision4Press platform.
Data correspond to usage on the plateform after 2015. The current usage metrics is available 48-96 hours after online publication and is updated daily on week days.
Initial download of the metrics may take a while.