Free Access
Fig. A.1
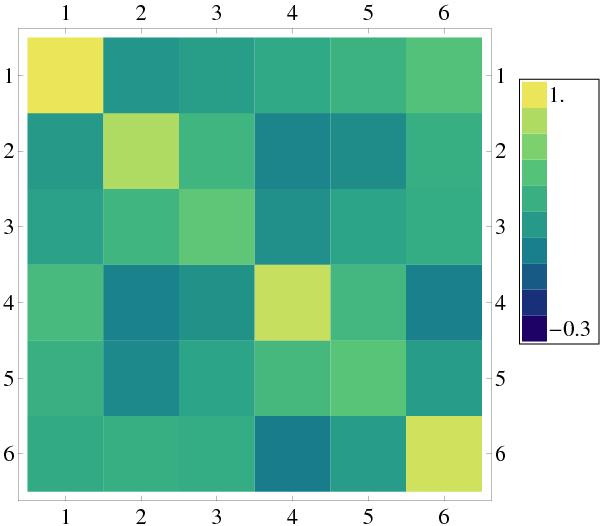
The inverse matrix of the Eq. (10)for the best fit model. The matrix closely resembles the fully analytical case except for the numerical part. Different shades of colour are applied to visualize the symmetries.
Current usage metrics show cumulative count of Article Views (full-text article views including HTML views, PDF and ePub downloads, according to the available data) and Abstracts Views on Vision4Press platform.
Data correspond to usage on the plateform after 2015. The current usage metrics is available 48-96 hours after online publication and is updated daily on week days.
Initial download of the metrics may take a while.