Fig. 2
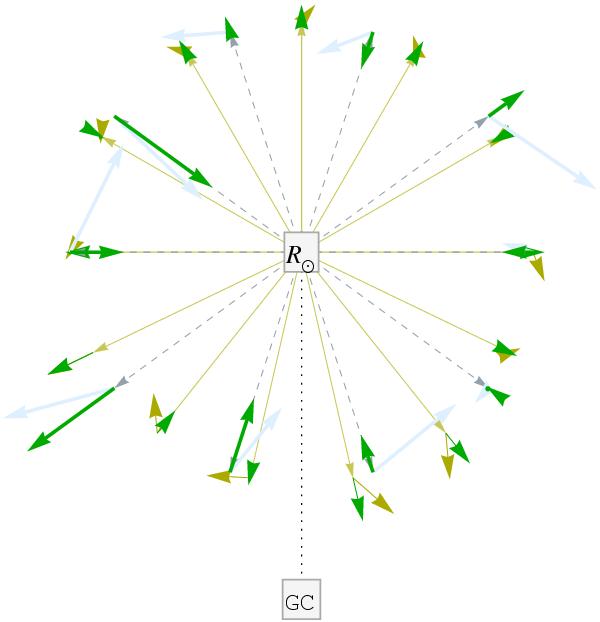
Schematic representation of the hypothesis of an anisotropic and isothermal distribution of an unbiased sample of thick disk velocities superimposed on a thin disk sample. The observer is located at the Sun’s position R⊙ at the centre. The Galactic centre (GC) is at the bottom of the figure. The directions on the celestial sphere to each star si are indicated with dashed arrows for thick disk stars and solid arrows for the thin disk stars. The green thick arrows represent the radial velocities of the thick disk, whose corresponding unknown true velocity vector is in light blue. The thin disk radial velocities are represented by the thin green arrows, and the corresponding unknown olive-green arrows represent the true velocity vectors. Note that the olive-green arrows are generally longer in the GC direction and shorter in the anti-Galactic centre direction as expected from the velocity dispersion trend.
Current usage metrics show cumulative count of Article Views (full-text article views including HTML views, PDF and ePub downloads, according to the available data) and Abstracts Views on Vision4Press platform.
Data correspond to usage on the plateform after 2015. The current usage metrics is available 48-96 hours after online publication and is updated daily on week days.
Initial download of the metrics may take a while.