Fig. 6
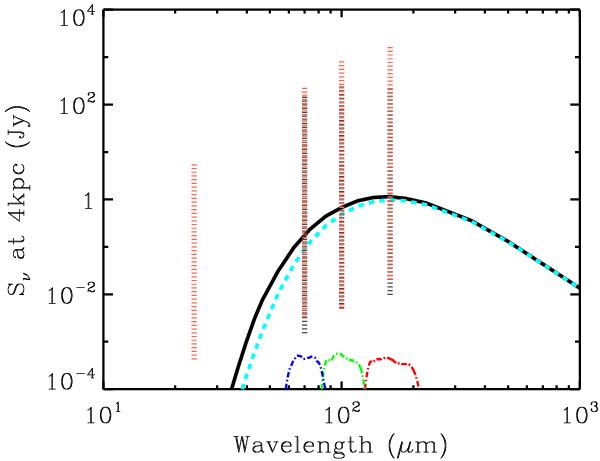
Example SED for a core with the median properties of the “near” sample: M = 2 M⊙ and T = 20 K. The solid black curve depicts the SED assuming optically thin emission over the full spectrum. The cyan dashed curve shows an SED with the same parameters, but without an assumption of optically thin emission. The blue, green, and red dash-dotted curves show the filter response function (× 10-3) for the 70 μm, 100 μm, and 160 μm bands, respectively. The full range of fluxes at each wavelength for 24 μm-bright (red dotted line) and 24 μm-dark (gray dotted line) are shown. All flux densities have been normalized to the fiducial 4 kpc distance.
Current usage metrics show cumulative count of Article Views (full-text article views including HTML views, PDF and ePub downloads, according to the available data) and Abstracts Views on Vision4Press platform.
Data correspond to usage on the plateform after 2015. The current usage metrics is available 48-96 hours after online publication and is updated daily on week days.
Initial download of the metrics may take a while.