Fig. 2
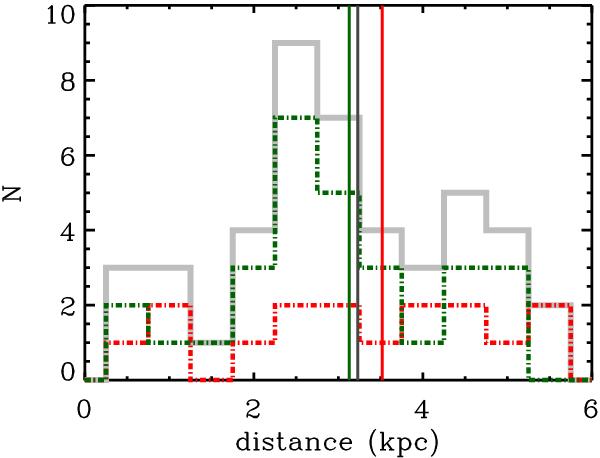
Histogram of distances of the 45 clouds in the sample in 0.5 kpc bins. The full sample is plotted in the solid gray histogram, the histogram for just the IRDCs is plotted in the green dot-dashed line, and the ISOSS targets are plotted in the red histogram. The median distance of the full sample, 3.2 kpc, is plotted in the solid gray line, and the median for the IRDC-only (3.1 kpc) and ISOSS-only (3.5 kpc) are shown with solid green and red vertical lines.
Current usage metrics show cumulative count of Article Views (full-text article views including HTML views, PDF and ePub downloads, according to the available data) and Abstracts Views on Vision4Press platform.
Data correspond to usage on the plateform after 2015. The current usage metrics is available 48-96 hours after online publication and is updated daily on week days.
Initial download of the metrics may take a while.